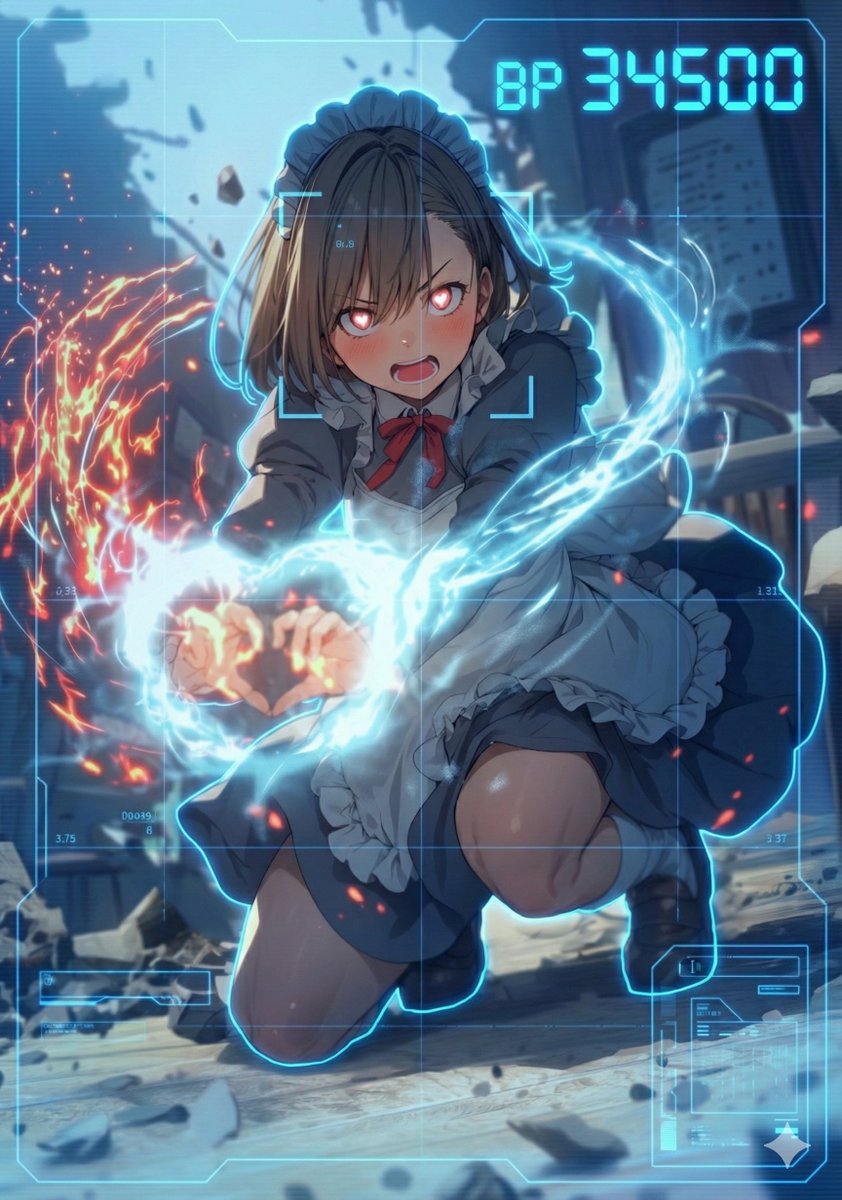
HUD battle power overlay for any character image
Use blue HUD color. task: "edit-image: add full-screen analysis HUD overlay only"
Prompt Library
Curated image, video and web design prompts from creators around the world. Copy any prompt, swap the subject or style, and generate with the latest models.
15,630 prompts · Updated daily · 100% free
606 prompts
Use blue HUD color. task: "edit-image: add full-screen analysis HUD overlay only"
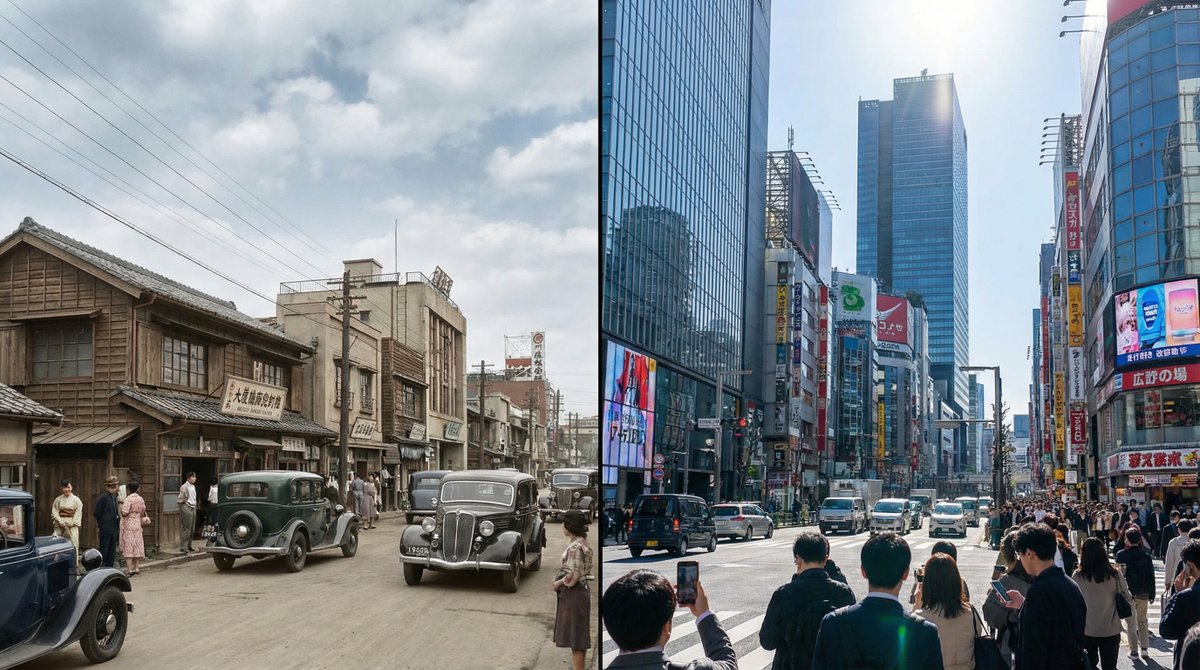
Generate a single photorealistic 16:9 image and split its composition into left and right halves. On each side, depict the same place, [LOCATION_NAME: {argument name="location_name_en" default="(any location)"}], at different eras. Left side: {argument name="left_year_en" default="(any year)"} · {argument name="left_time_en" default="(time)"} Right side: {argument name="right_year_en" default="(any year)"} · {argument name="right_time_en" default="(time)"} Keep the camera position exactly the same and use the following coordinates: [LATITUDE,LONGITUDE: {argument name="coordinates_en" default="(latitude and longitude of any place)"}] Do not include any text in the image (years, labels, watermarks, etc.). Do not specify detailed visuals. Leave all aspects such as architecture, light, cars, people, signs, materials, atmosphere, and composition up to Nano Banana Pro. Each era should feel natural and together form a side-by-side time comparison image within a single 16:9 frame. --ar 16:9 --stylize 800 --v 6
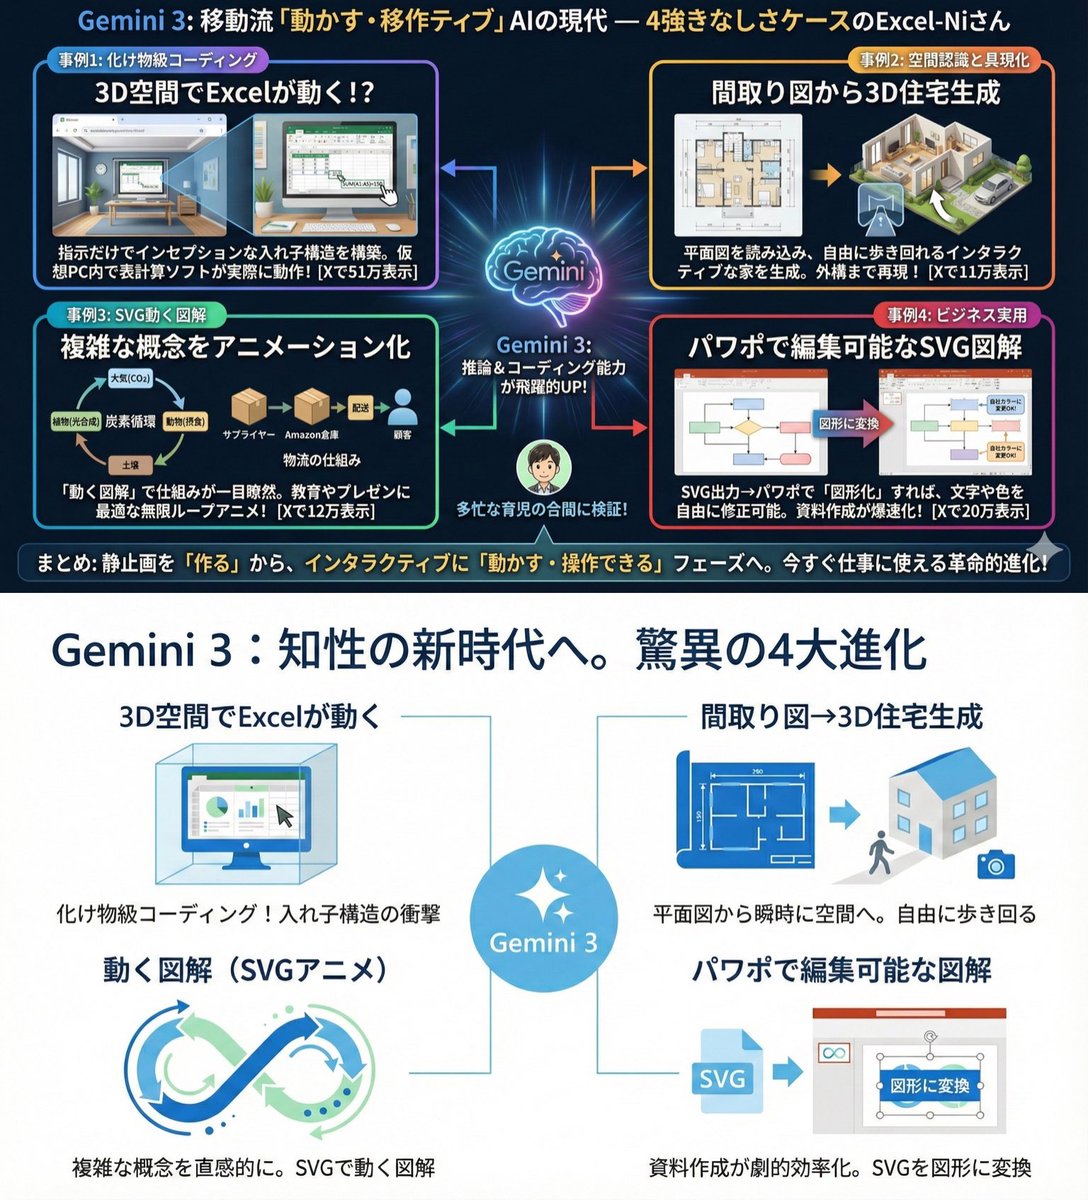
Use extremely little text and focus on graphical expression. Suppress Japanese character garbling. Use Hiragino Gothic as the main font. Keep the content as is, but make the colors and design similar to Microsoft 365. Use a flat and simple design.
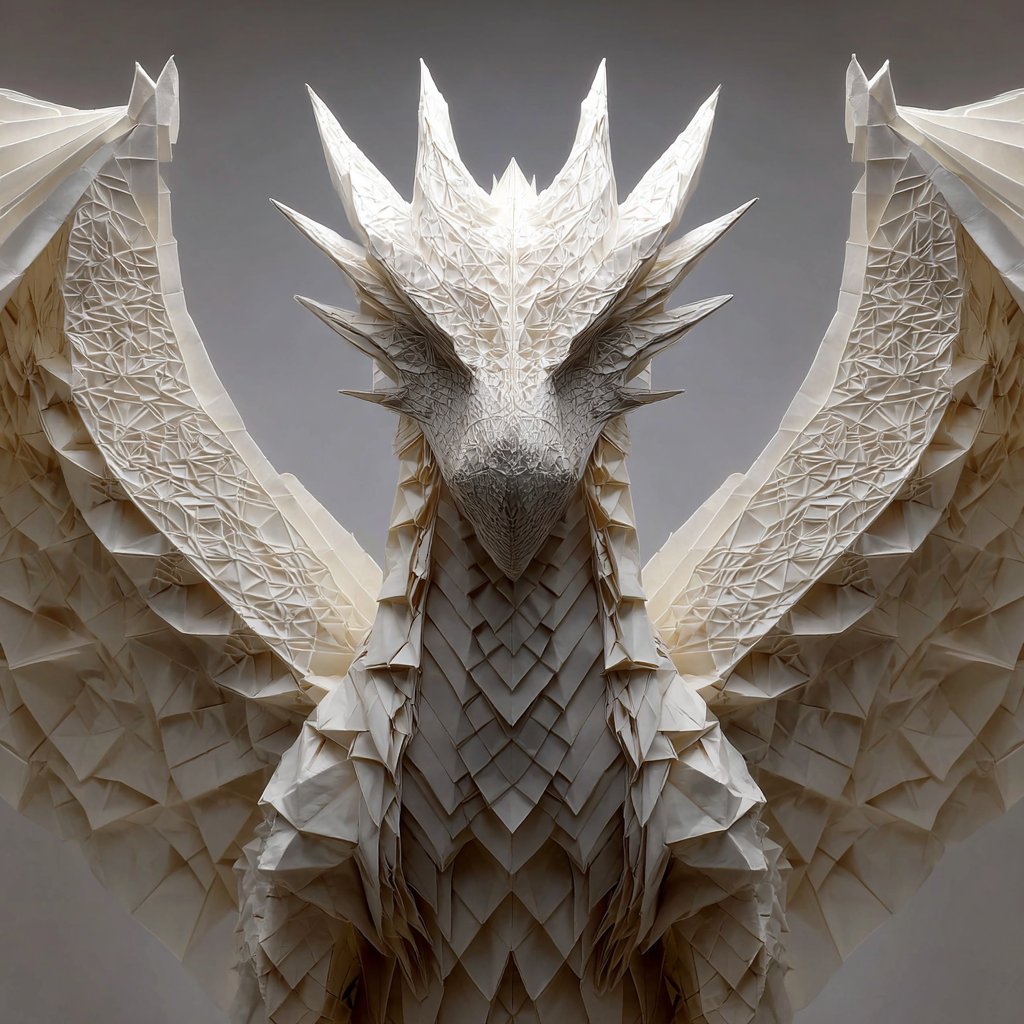
Create a {argument name="grid_layout_en" default="2 by 3"} grid of step-by-step visual folding instructions, from a flat sheet to the final model. Each step should include a person completing that step.
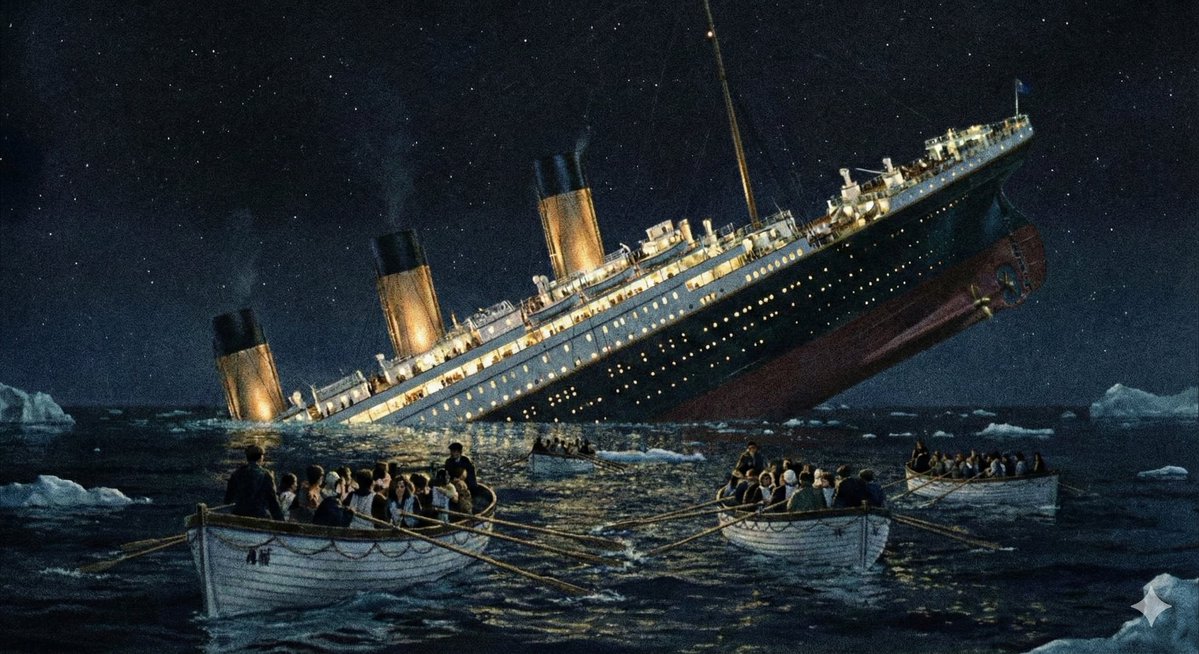
Create an image of the major event that happened at these coordinates: {argument name="coordinates_en" default="41°43′32″N 49°56′49″W"}.
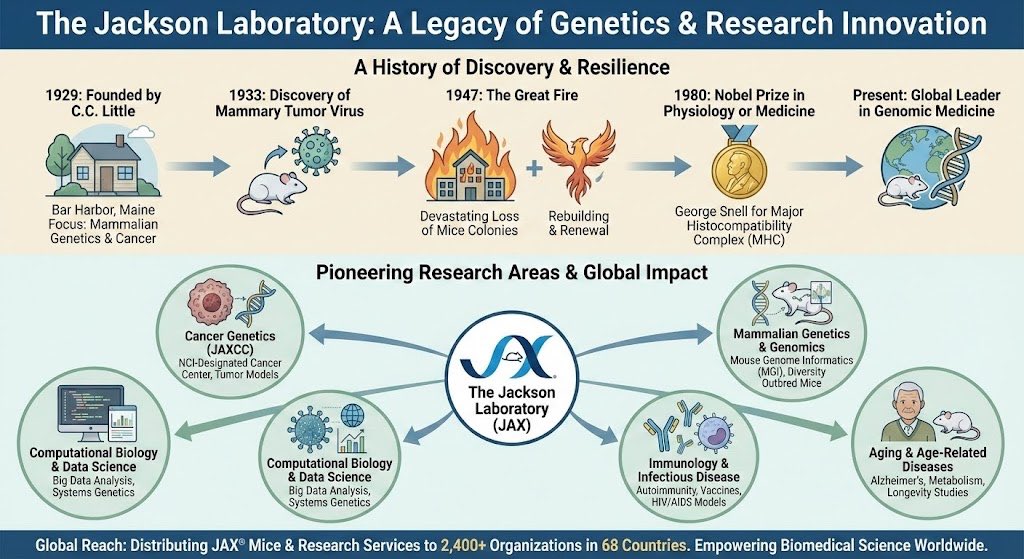
Infographic about {argument name="topic_en" default="the Jackson Laboratory"}.
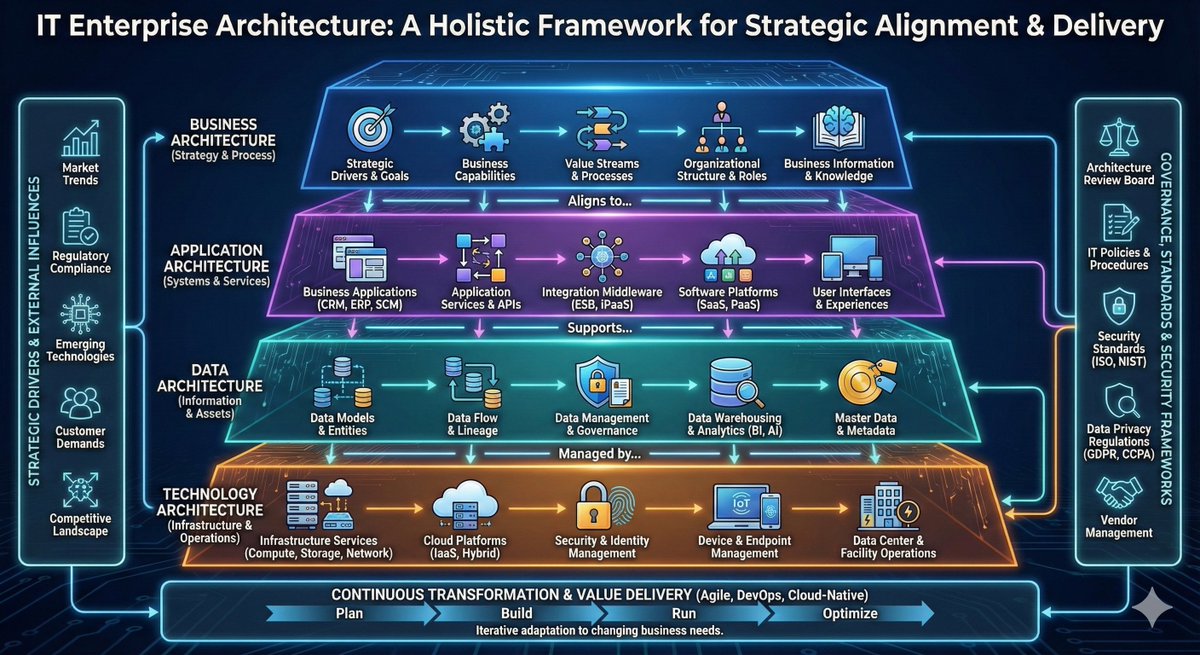
Create a very high-detail infographic image that describes IT careers or IT jobs related to the Software Development Life Cycle.
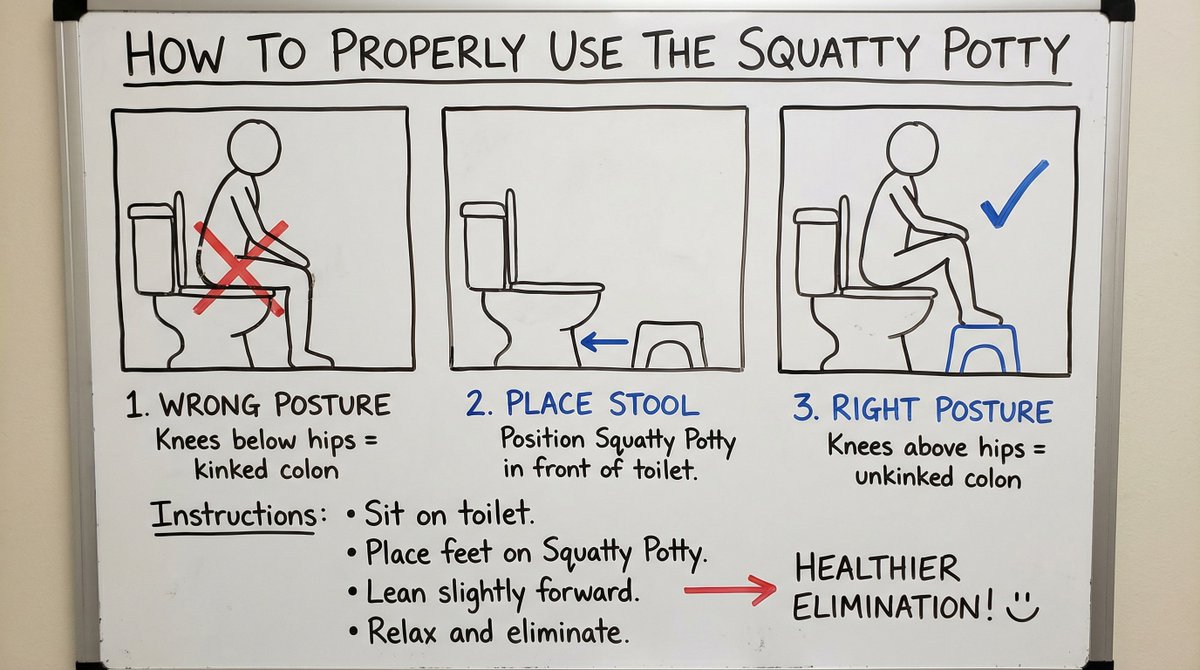
A detailed whiteboard illustration and instructions on how to properly use the Squatty Potty.
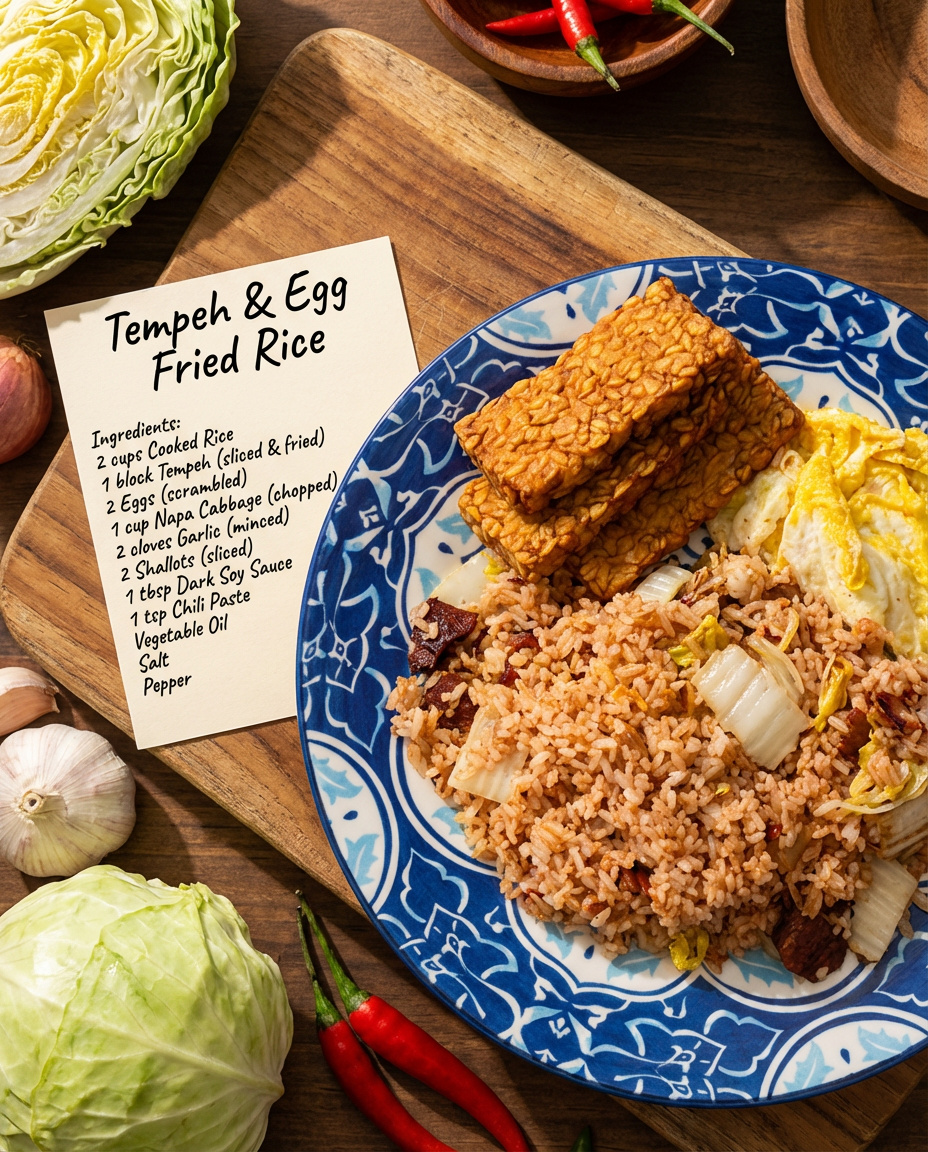
Make a detailed recipe for this dish with all the ingredient names and their raw ingredients. Make it look like a real photo shoot.
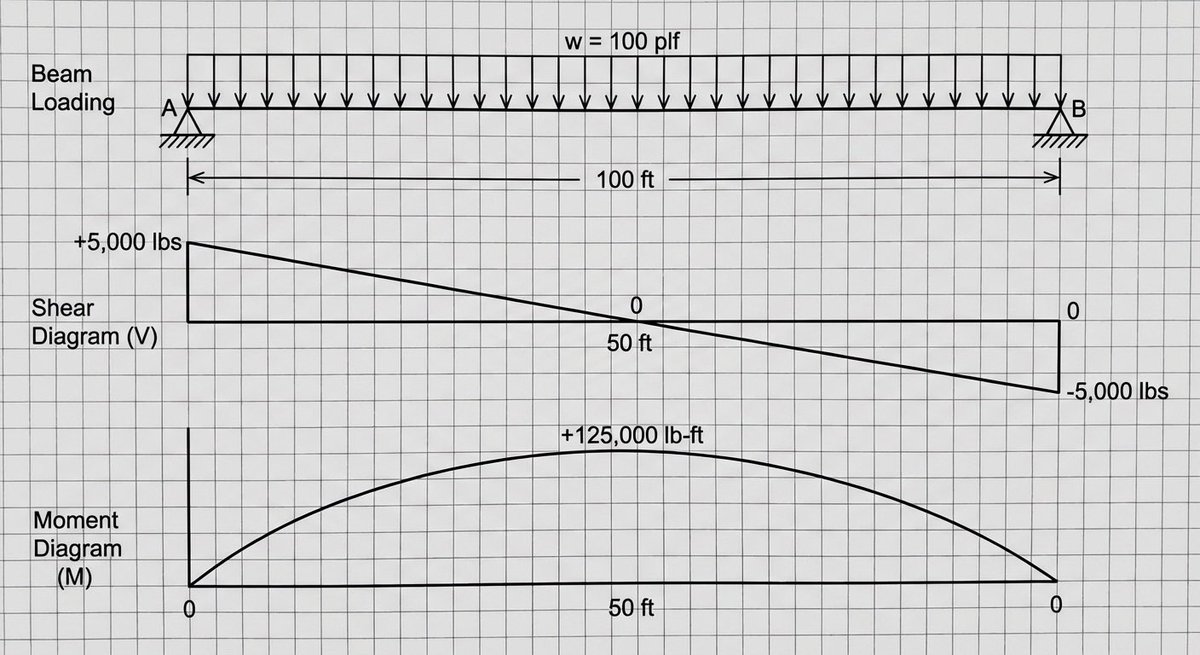
A shear and moment diagram for a simply supported beam with a uniform load of {argument name="load_en" default="100 plf"}. The beam is {argument name="length_en" default="100 feet"} long.
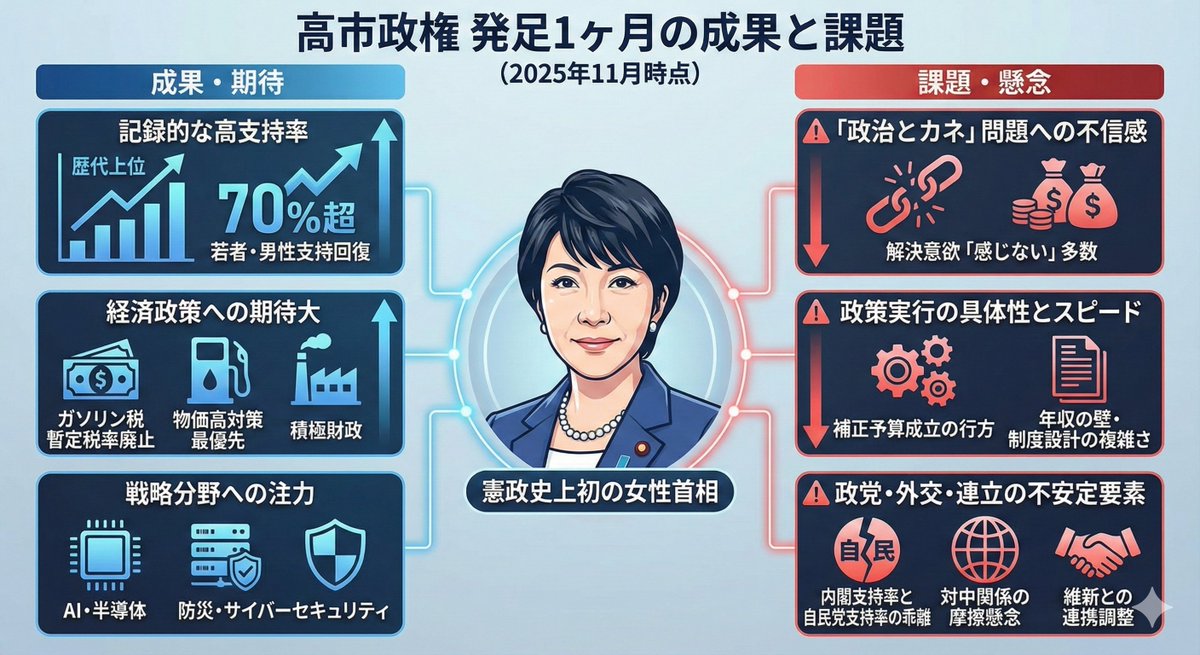
I want an infographic showing the achievements and issues of the Takaichi administration over the past month.
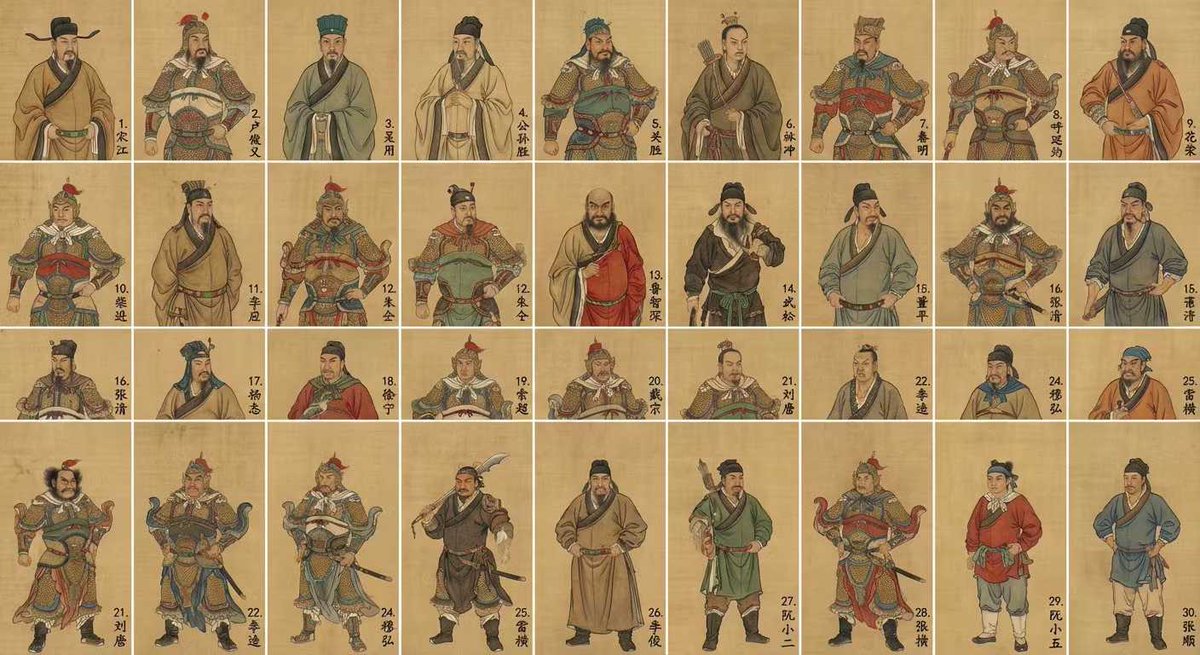
Generate an image of the top 30 characters from "Water Margin" in a grid format, in the style of Chinese gongbi painting, with each character’s name written in the lower‑right corner of their cell.

Create an image showing the individual pattern pieces of this shoe, each separated and placed on a neutral background.
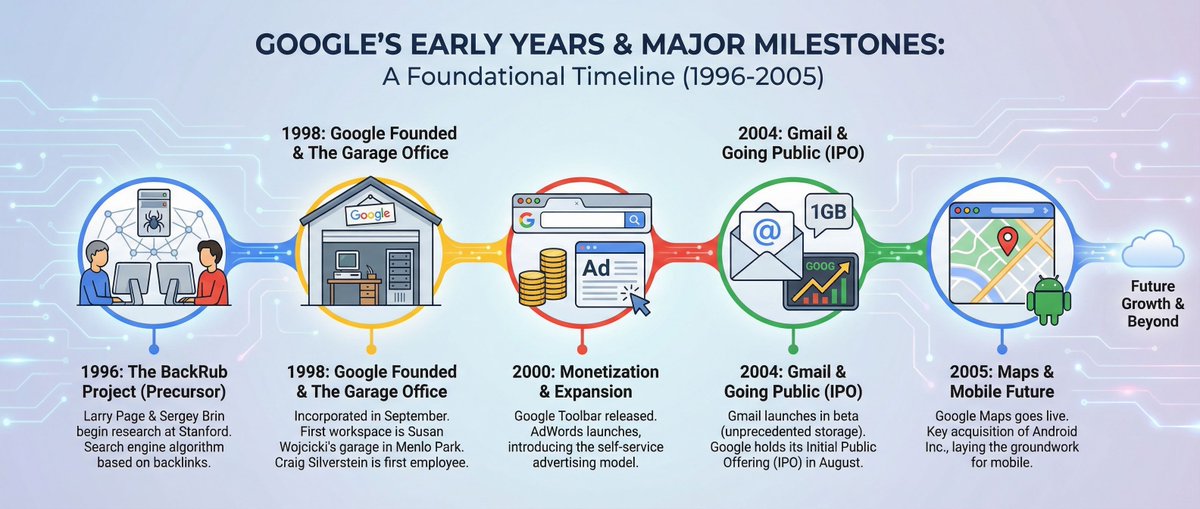
Please create an infographic about Google’s early years and its major milestones.
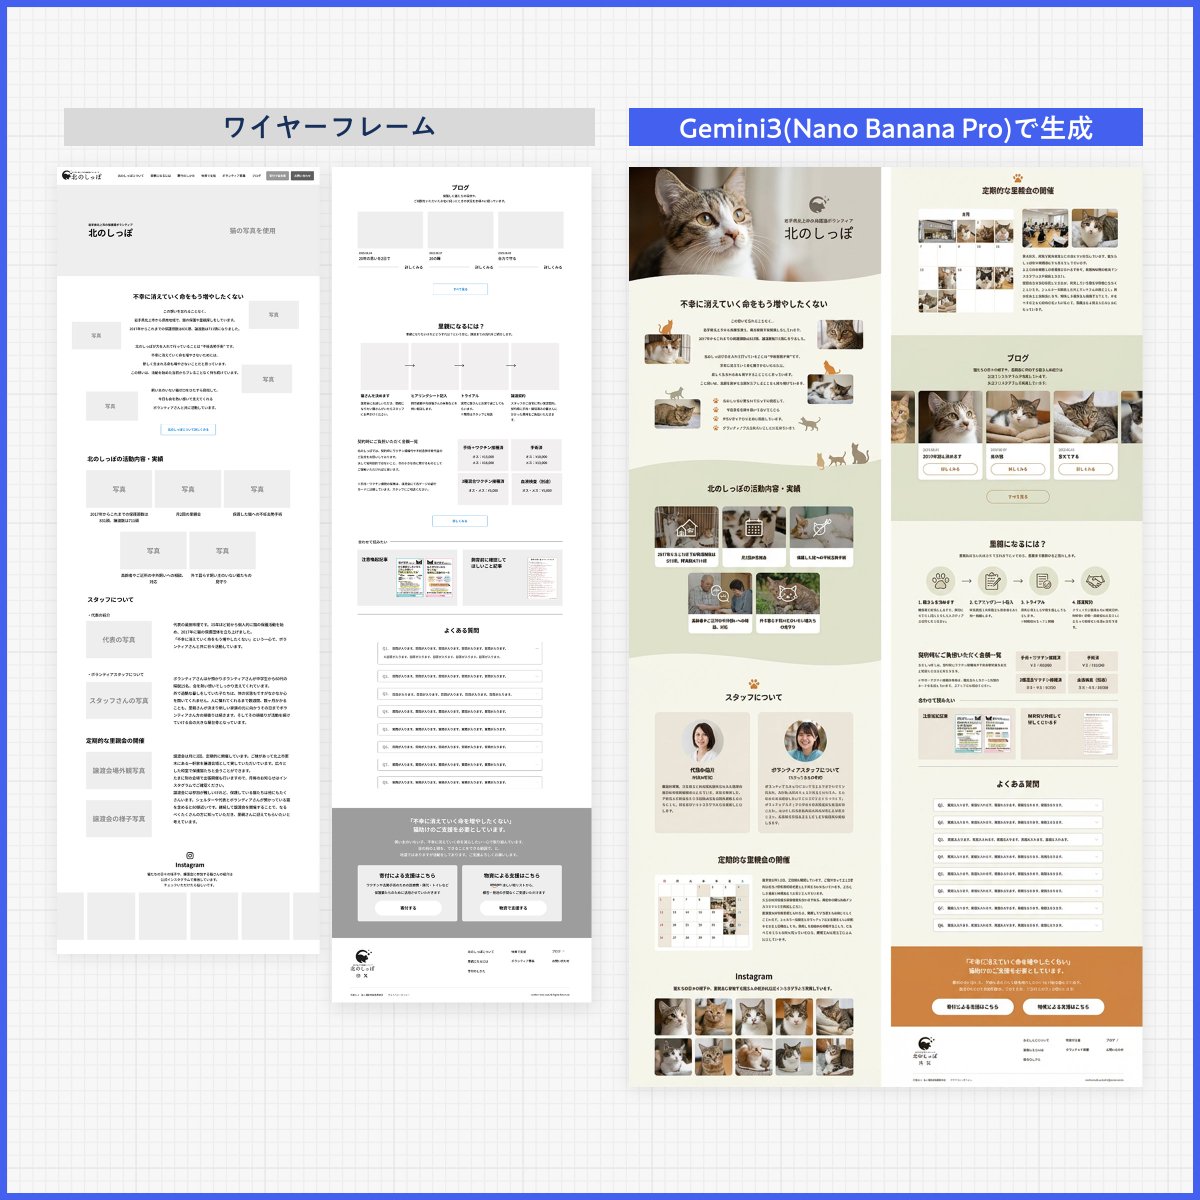
Please create a design based on the text in the reference image. Ignore the layout. Design it like a professional designer would. Create a clean, well‑organized design with a beautiful flow.
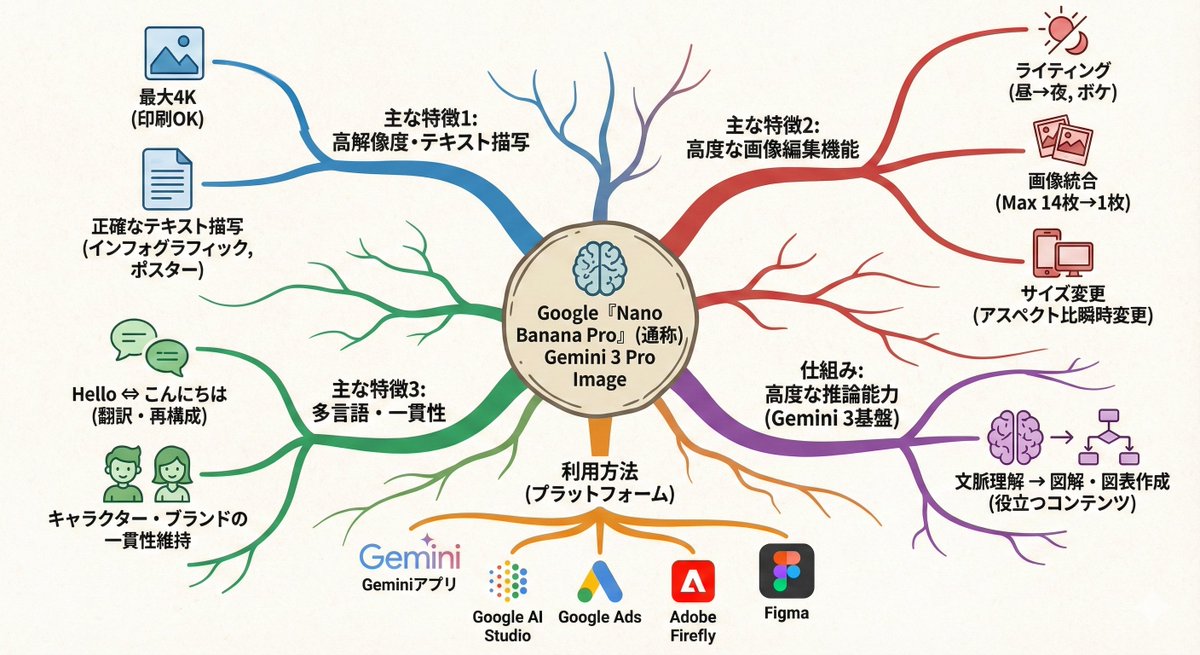
Turn this text into a map that expands outward from the center. Key points: - Put the main theme in the middle - Arrange related elements as branching nodes - Use color coding to separate categories - Add simple icons - Use an organic layout Make it feel like my thoughts are being organized.
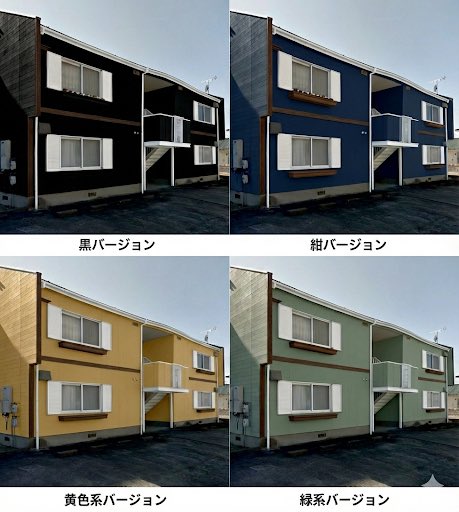
So that I can do a paint simulation, make a single image that lets me compare several different patterns.
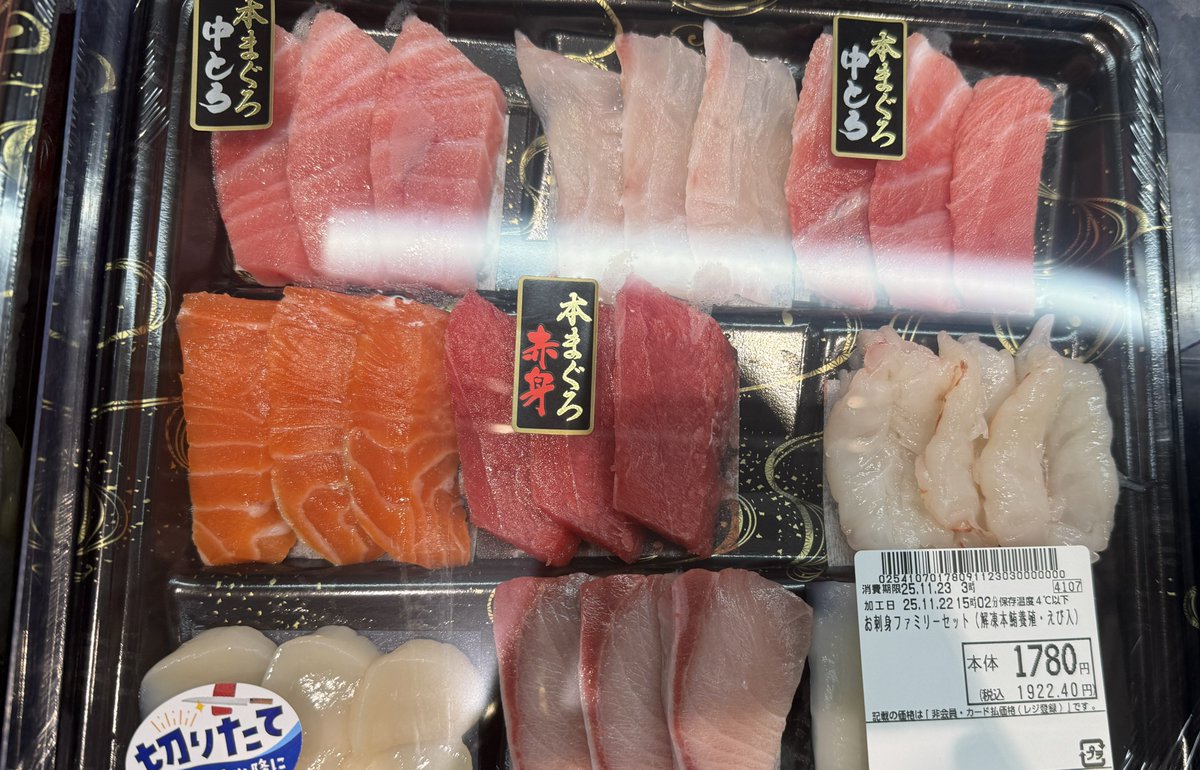
Reconstruct the ingredients from the reference image as living creatures. Arrange them in the same order, and clearly label each with its name, calories, and nutrition index. Finish it as a “ingredient introduction poster” style image with scientific fun facts added.
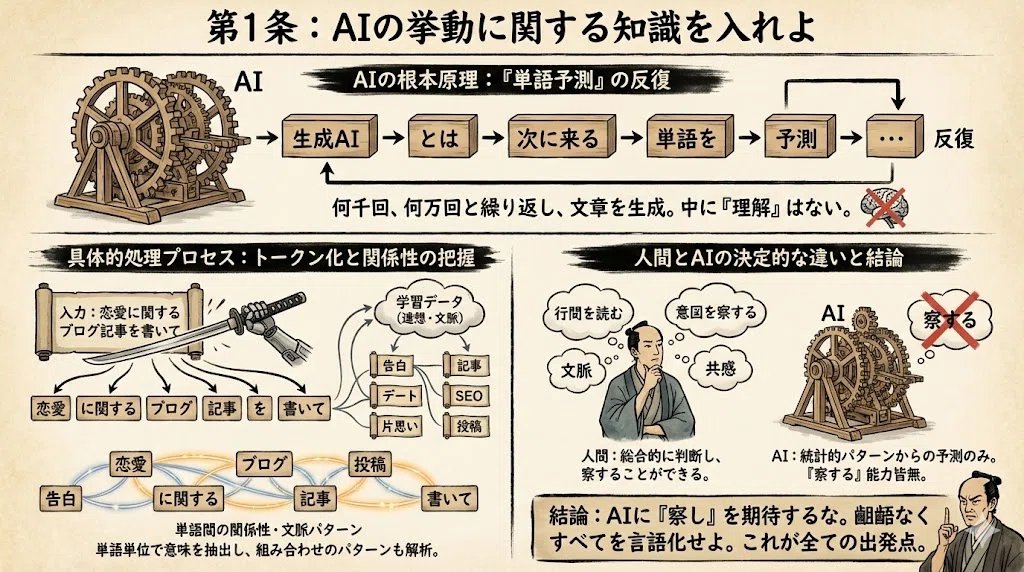
From the information below, create an explanatory image in infographic format. Use a classic-style Japanese font. Aspect ratio: 16:9. lang: ja. Reference information: {argument name="reference_info_en" default="[insert your reference information here]"}
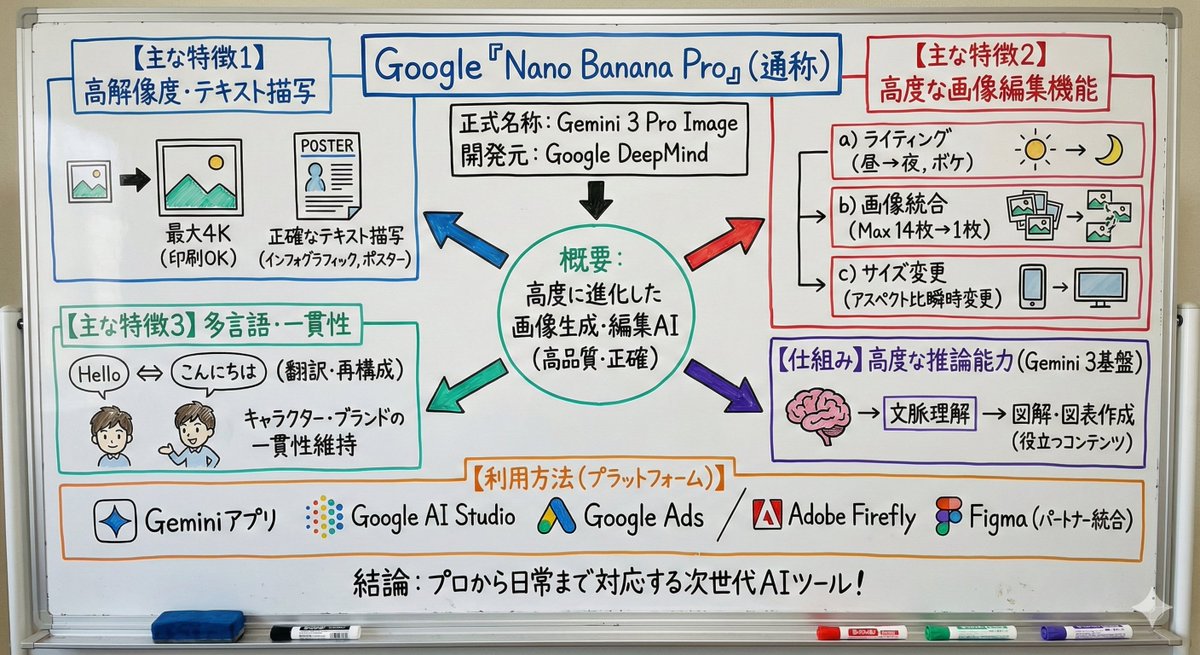
Turn this text into a simple whiteboard-style diagram. Points: - Place the main concept in the center - Use arrows to show flow and relationships - Enclose important parts in boxes - Keep explanations short and focused only on key points Make the size 16:9 and design a clean diagram that is easy to view on a smartphone.
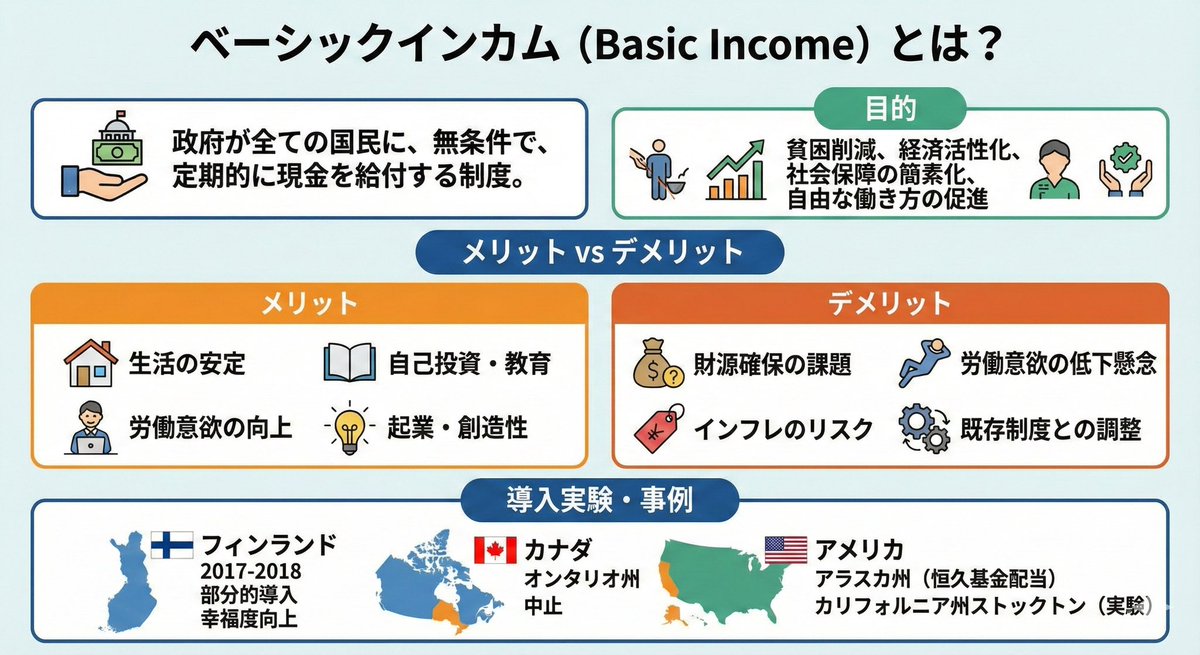

Turn the advantages of investing in Vietnam into a single slide.
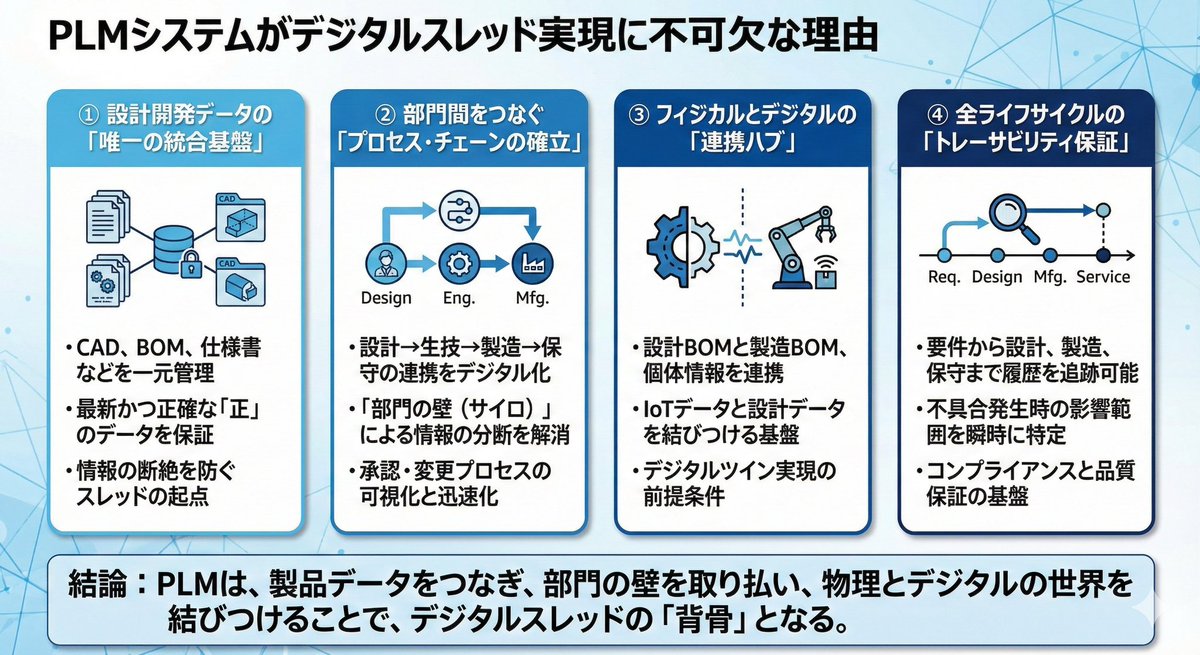
With the title “{argument name="title_en" default="Why PLM systems are essential for realizing a digital thread"}”, first think through and list the elements that support this message, then turn them into a single presentation slide.
Some prompts are collected from creators on X. Copyright belongs to the original authors.