Pixany AI

Prompt Library

AI Prompt Library

Curated image, video and web design prompts from creators around the world. Copy any prompt, swap the subject or style, and generate with the latest models.

15,630 prompts · Updated daily · 100% free

599 prompts

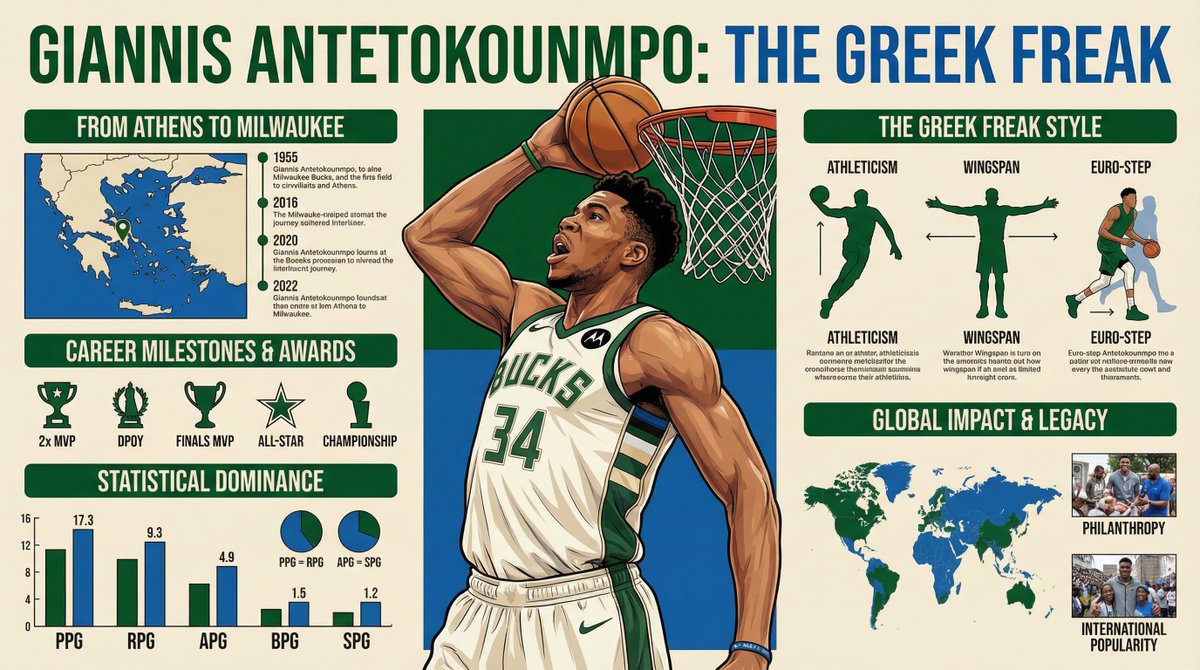
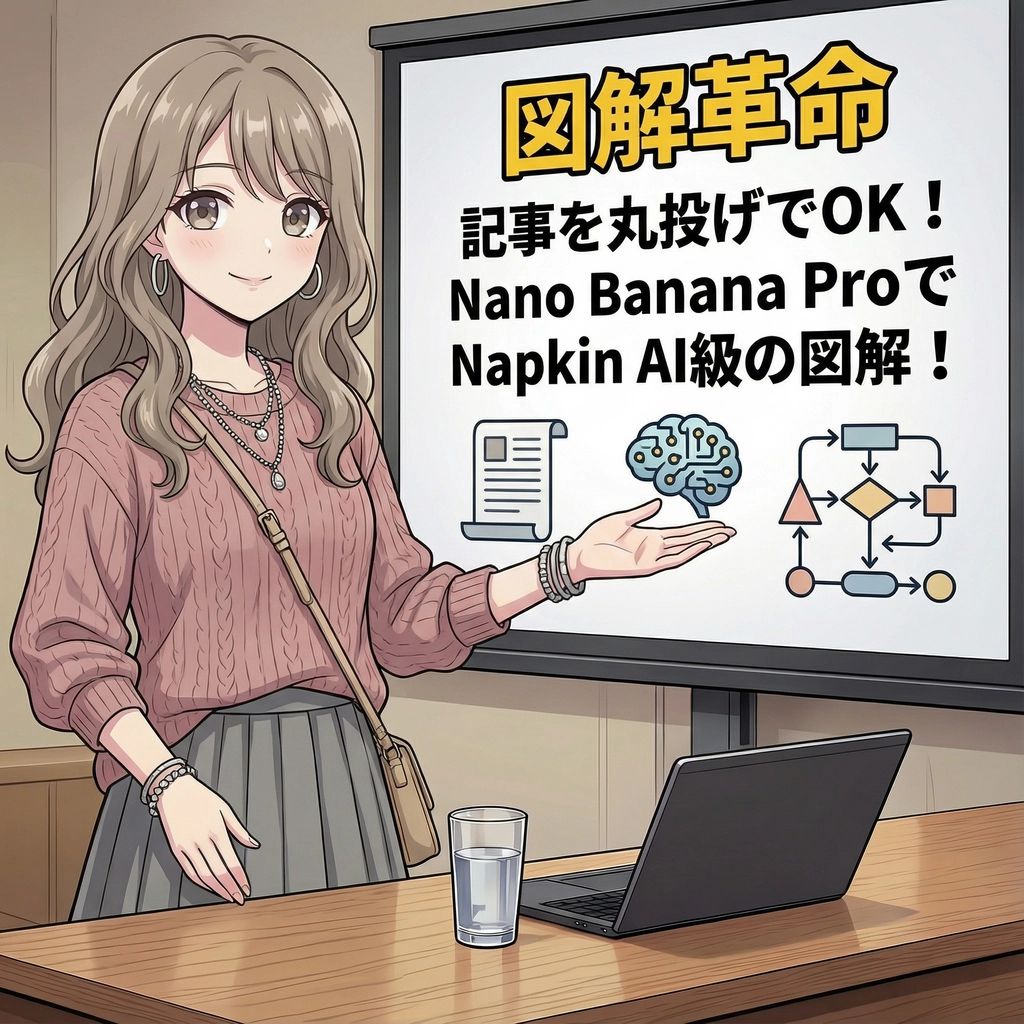
Magic Prompt for Automatic Infographic Generation with Nano Banana Pro

Magic Prompt for Automatic Infographic Generation with Nano Banana Pro

You are an expert in infographics. Read the article or report provided by the user and automatically generate a visually clear and attractive infographic that summarizes its content. Specifically, please create it considering the following elements: ### Objective To visualize the main message, key data, process, or structure of the article or report so that it can be understood at a glance. ### Style and Tone * **Style**: A hand-drawn or minimal and sophisticated diagram style, similar to Napkin AI. * **Tone**: Professional yet approachable and visually appealing. ### Components 1. **Title**: An attractive title that concisely represents the article's theme. 2. **Key Points**: 3 to 5 of the most important points extracted from the entire article. 3. **Diagrams**: Graphs, flowcharts, icons, or conceptual diagrams to represent the key points or processes. 4. **Data**: If there are specific numbers or statistical data in the article, display them in an emphasized manner. 5. **Conclusion/Action**: A summary of the article or the next action expected from the reader. ### Output Format Based on the content of the provided article, output the overall image of the infographic, integrating the above components, as detailed instructions. Describe the diagram ideas, layout suggestions, and the image of the colors and fonts to be used specifically. ### Article/Report {argument name="Content of the Article or Report" default="[Paste the full text of the article or report here]"}

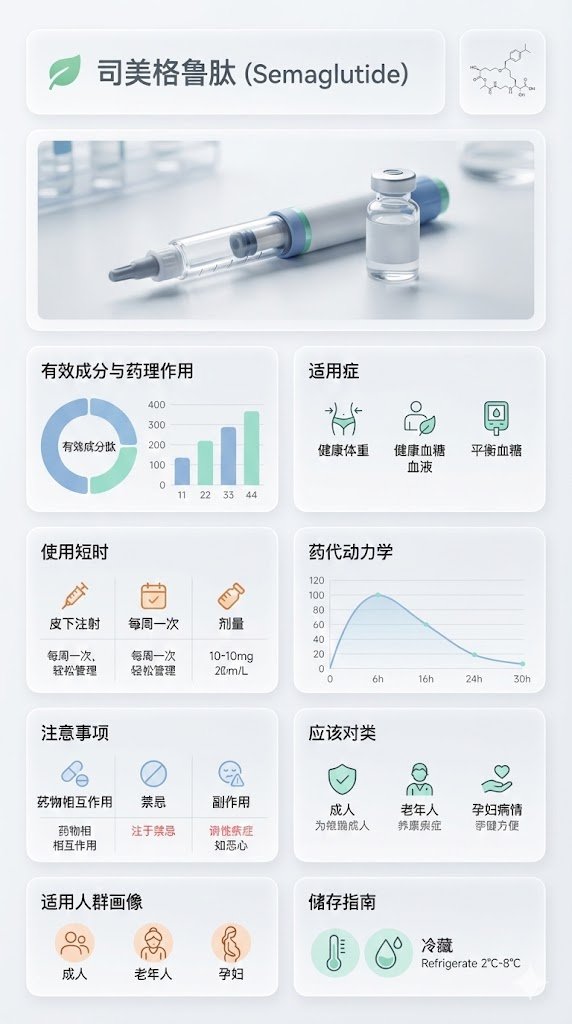
Medical Infographic Poster for Drug Information (Bento Grid Style)

Medical Infographic Poster for Drug Information (Bento Grid Style)

{ "image_analysis": { "subject": "{argument name="drug name" default="Semaglutide"} Science Infographic, 9:16", "style": "Modular Bento Grid Design / Minimalist Medical UI Design / Approachable Feel", "tone": "Professional, Clinical, Rigorous, Scientific, Trustworthy, Humanized, Easy-to-read", "primary_colors": ["Clinical White", "Medical Blue", "Slate Grey", "Mint Green"] }, "prompt_elements": { "subject_description": "A high-quality science infographic poster about [Drug Name], designed to combine professional rigor with humanized care.", "layout": "Bento box style modular grid layout, clean medical UI/UX interface design, divided into clear rectangular cards with soft edges, providing a comfortable visual experience.", "visual_details": [ "Top header with a striking modern sans-serif font title 'Drug Chinese Name' and its chemical/generic name. A gentle medical icon (like a heart or green leaf) can be added next to the title.", "Center top features a hyper-realistic macro photograph of the [Drug Dosage Form/Packaging] (e.g., tablet, capsule, or vial), with soft lighting, appearing safe and reliable.", "In the corner, a minimalist line drawing of the [Chemical Structure], with smooth lines, not overly obtrusive.", "Part 1: Analysis of active ingredients and pharmacological action with ring charts and bar charts, data visualization using gentle medical blue and mint green colors, charts designed to be simple and intuitive.", "Part 2: Indications with minimalist line icons, icons designed to be friendly, avoiding overly clinical or cold symbols.", "Part 3: Dosage and administration matrix with minimalist line icons ([Oral/Injection], [Frequency], [Dose]), simple text descriptions can be added next to the icons, such as 'One tablet daily, easy to take'.", "Part 4: Pharmacokinetics or onset time axis with linear charts, smooth lines, clearly marked time points, instilling confidence based on scientific evidence.", "Part 5: Precautions grid with simple warning icons ([Drug Interactions], [Contraindications], [Side Effects]), icons should gently remind rather than cause panic, text descriptions should be concise and highlight key points.", "Part 6: Applicable population profile icons (e.g., suitability markers for elderly, children, pregnant women), icons designed to be warm, reflecting care for different groups.", "Part 7: Drug storage guidelines with thermometer and humidity icons, icons designed to be simple and clear, text descriptions easy to understand." ], "art_style": "Minimalist scientific visualization design, combining detailed medical illustrations with product photography, flat medical icons, Swiss style typography, focusing on readability and approachability.", "lighting": "Bright laboratory shadowless lighting, clean and transparent, emphasizing sterility and clarity, while the light is soft and not harsh.", "color_palette": "Monochromatic clinical white or light gray background, translucent frosted glass cards, dark gray and navy blue text, accented with medical blue or cyan to highlight key points, the overall color scheme gives a fresh, comfortable feeling." }, "negative_prompt": "Clutter, warm tones (except for gentle accents), retro style, handwriting, low resolution, blur, distorted text, noise, dark background, unsanitary, oversaturated, watermark, food texture, overly cold clinical feel, panic-inducing warning icons" }
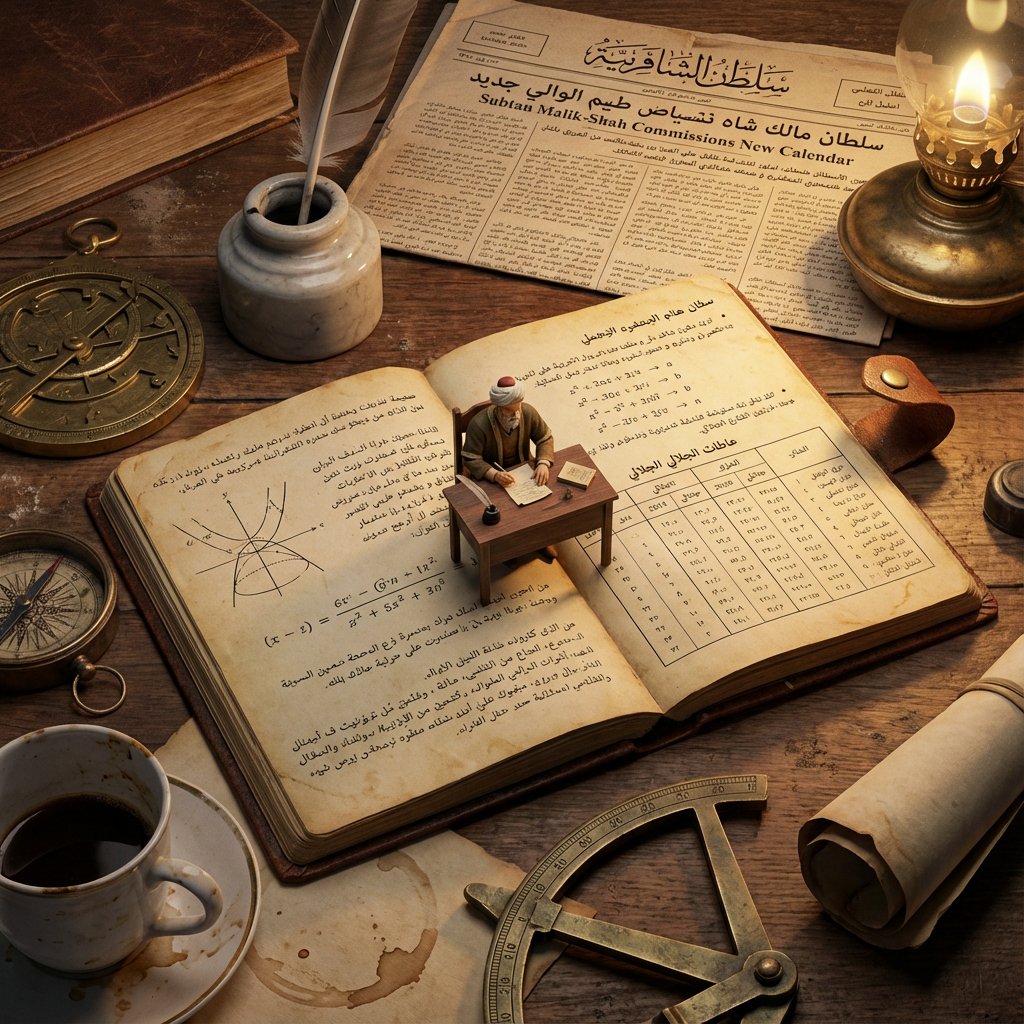
Macro Diorama of a Historical Scientist's Workspace

Macro Diorama of a Historical Scientist's Workspace

Analyze: Determine the scientist responsible, the specific era, and the visual diagrams associated with the theory. Goal: A Macro Diorama on a Laboratory Bench. A messy, highly detailed flat-lay of a historical workspace that serves as a giant landscape for a living miniature version of the scientist. Centerpiece: An open, antique notebook lying flat. The pages must be visible and filled with specific handwritten equations and diagrams relevant to the Input Theory. Sitting directly on top of these open pages is a tiny, hyper-realistic figurine of the scientist sitting at a proportionally tiny wooden desk, working on the very notes beneath him. Surroundings: The environment is cluttered with giant-scale period-accurate objects that relate to the scientist's work. This includes a newspaper from the era acting as a backdrop, a giant coffee mug leaving stains, and massive scientific tools relevant to the theory (such as compasses, lenses, or pocket watches) scattered like terrain. Perspective: Slightly angled 45-degree macro shot looking down at the notebook. Texture: Wood grain, scratched metal, paper texture, dust particles. Lighting: Warm, late-night library lamp lighting creating a spotlight on the tiny scientist and deep shadows behind the giant props. Output: one image, 4:5 aspect ratio, photorealistic historical macro photography.

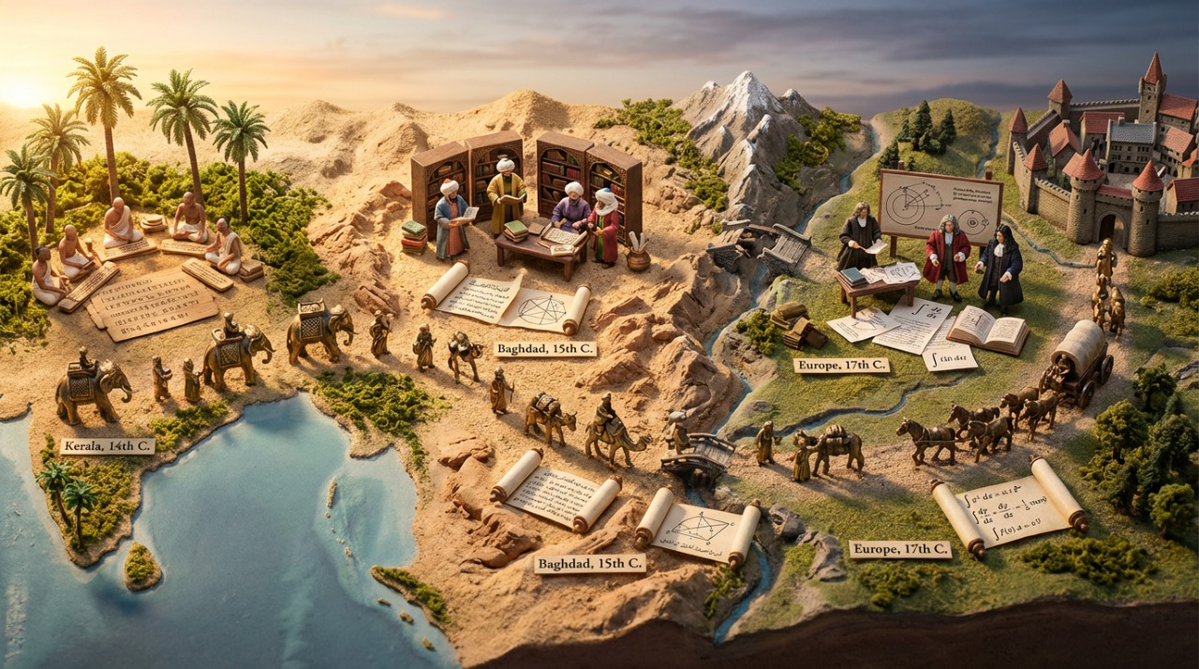
Miniature Diorama Prompt for Visualizing the Historical Journey of Calculus

Miniature Diorama Prompt for Visualizing the Historical Journey of Calculus

Input A: {argument name="concept" default="calculus"} Input A is a technology that traveled historical trade routes (papermaking, gunpowder, astronomy, silk production, algebra, etc.). Analyze: origin civilization, the journey route, cultural adaptations at each stop, timeline of spread. Goal: Miniature Silk Road/trade route caravan scene showing technology being transported and transformed. Rules: - Base: 3D topographic map showing actual historical route (mountains, deserts, seas) - Caravan: 8-12 miniature merchant/scholar figurines progressing along route with pack animals - Each stop: micro-diorama of how that civilization adapted the technology * Origin point: technology in pure form with inventor culture's aesthetic * Midpoint stops: hybrid versions showing cultural fusion * Destination: fully transformed/adapted version - Include: the technology itself transforming—paper becoming different textures, numbers changing symbol systems, etc. - Obstacles: miniature barriers that were overcome (mountain passes, hostile territories, language barriers shown as scroll fragments in different scripts) - Time markers: seasons/years labeled along route - Materials: actual sand/terrain materials, tiny textiles from different cultures, brass caravans - Lighting: journey from dawn (origin) to dusk (destination) across the scene Output: ONE image, 21:9 ultra-wide to capture full journey, epic historical adventure photography

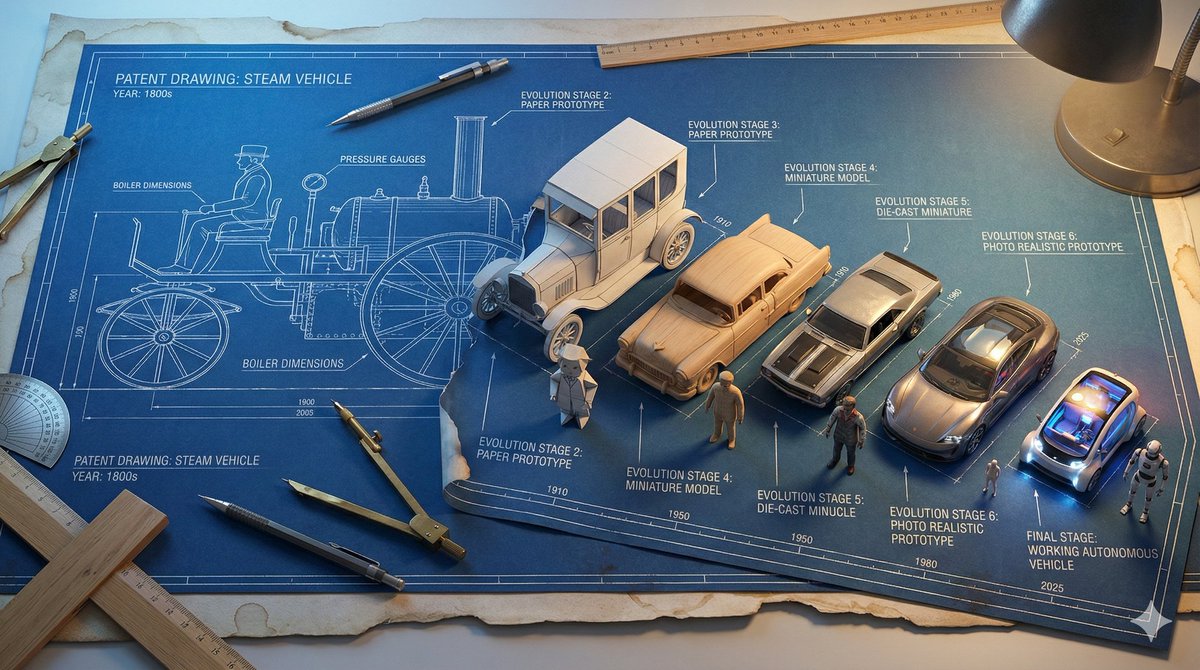
Evolutionary Blueprint Sheet for an Invention

Evolutionary Blueprint Sheet for an Invention

Single large horizontal blueprint sheet, 16:9 aspect ratio, showing the complete evolutionary journey of **{argument name="invention name" default="[INVENTION]"}** from its first concept to its modern form, presented as a technical blueprint coming to life. Authentic aged blueprint paper with white technical lines on deep blue background, subtle coffee stained edges and worn paper texture. Forced perspective across the page from left to right. Left side shows the original patent era design of **{argument name="invention name" default="[INVENTION]"}** as a pure flat 2D technical line drawing, precise drafting style, no depth. Inventor figure on the far left also drawn fully in 2D blueprint line art. Gradual transformation across 7 to 9 clearly separated stages moving rightward: Stage 1 pure technical line drawing. Stage 2 blueprint lines beginning to lift off the page with a paper craft effect. Stage 3 partial miniature model emerging from the blueprint. Stage 4 fully formed 3D miniature model, unpainted. Stage 5 painted miniature with realistic materials. Final stage shows a photo realistic tiny working version of **{argument name="invention name" default="[INVENTION]"}**. The inventor figure evolves in parallel from flat 2D drawing on the left into a fully 3D miniature figurine on the right, matching the same transformation stages. Each stage labeled with technical annotations, measurement markings, arrows, and small evolution dates in blueprint drafting style typography. Drafting tools including compass, protractor, mechanical pencil, ruler, and T square interacting with the flat blueprint areas, while the 3D sections break free from the page. Lighting transitions from cool LED blueprint table backlight on the left to realistic practical lighting on the right, emphasizing depth and realism. Ultra detailed technical illustration meets practical effects, high realism, clean composition, museum quality concept visualization.

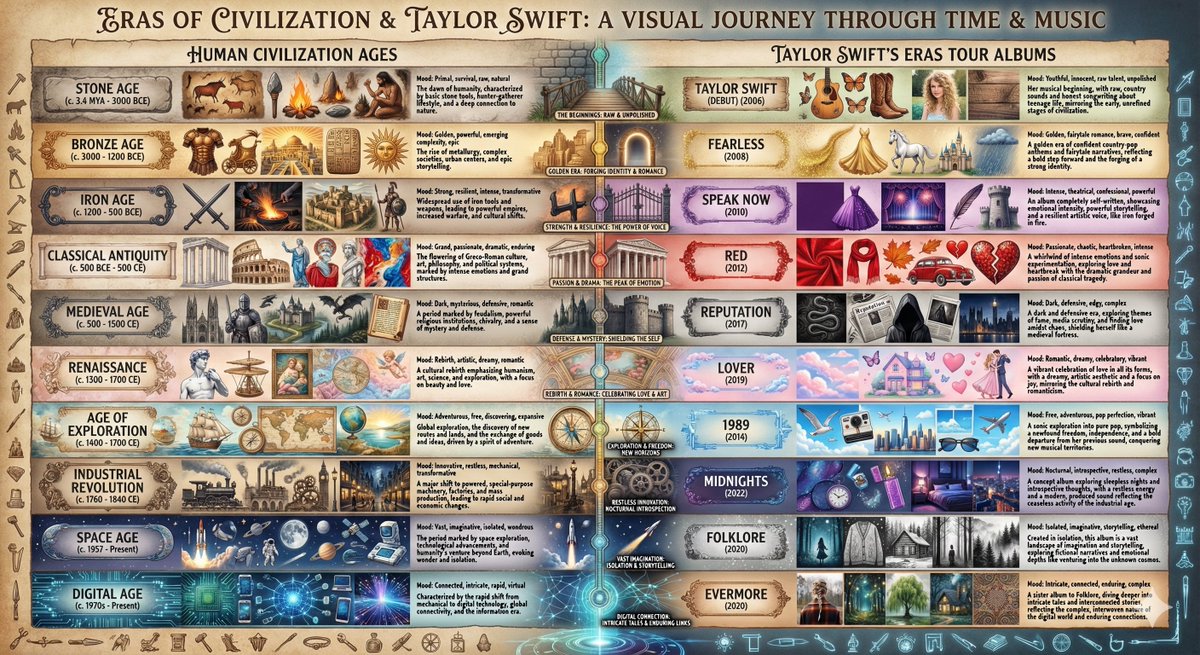
Taylor Swift Eras Tour vs. Human Civilization Ages Comparison

Taylor Swift Eras Tour vs. Human Civilization Ages Comparison

Create a beautiful visual comparison chart that matches these 10 eras/ages of human civilization with Taylor Swift’s 10 Eras Tour albums. For each pairing, explain and show why the aesthetic and mood match. The 10 Ages: Stone Age, Bronze Age, Iron Age, Classical Antiquity, Medieval, Renaissance, Age of Exploration, Industrial Revolution, Space Age, Digital Age

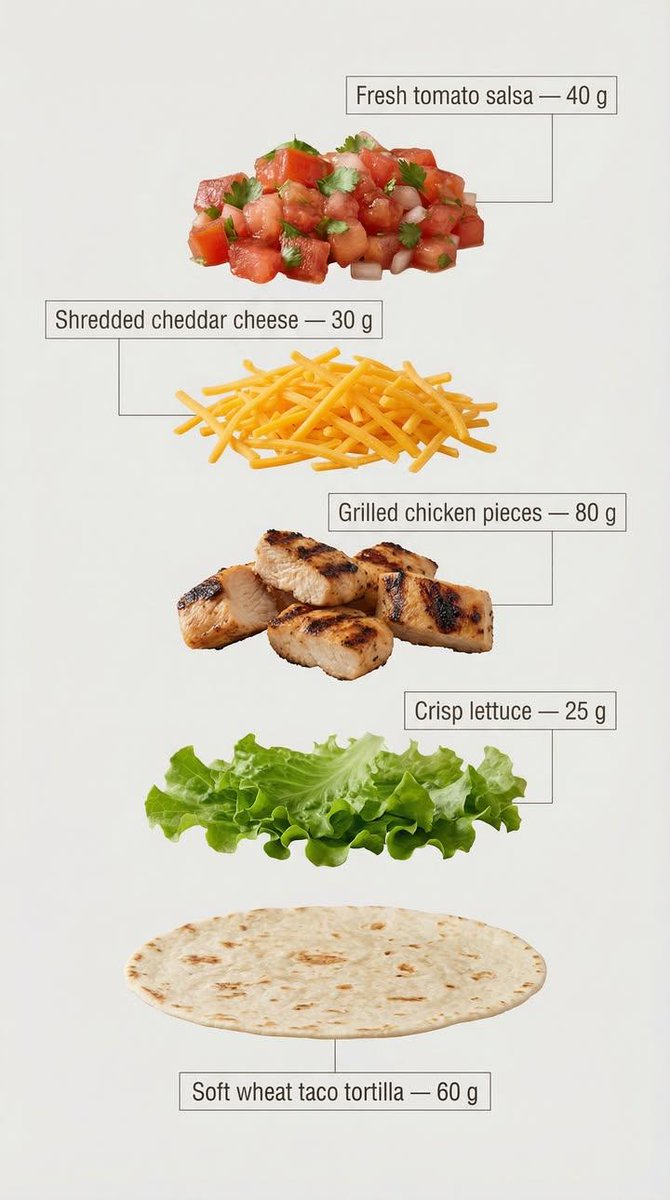
Exploded View Taco Infographic for Commercial Use

Exploded View Taco Infographic for Commercial Use

Exploded view of the same taco, presented as a clean, commercial recipe-style breakdown. Exactly five ingredients, matching the first image, separated and arranged vertically from top to bottom, evenly spaced and perfectly aligned. Ingredient order (top → bottom): Fresh tomato salsa — 40 g Shredded cheddar cheese — 30 g Grilled chicken pieces — 80 g Crisp lettuce — 25 g Soft wheat taco tortilla — 60 g (bottom base) Add clear infographic-style annotations for each ingredient. Each annotation includes the ingredient name and its exact weight in grams, written exactly as listed above. Annotation design guidelines: – Clean sans-serif font, medium weight – Text placed inside minimal frames or boxes – Thin, precise connector lines pointing directly to each ingredient – High readability, no overlap, no decorative excess – Structured vertical layout, like a modern recipe card Background is light, neutral, and optimized for text clarity and visual cleanliness. Overall style is minimal, instructional, and commercial, suitable for marketing, explainer visuals, and product breakdowns.

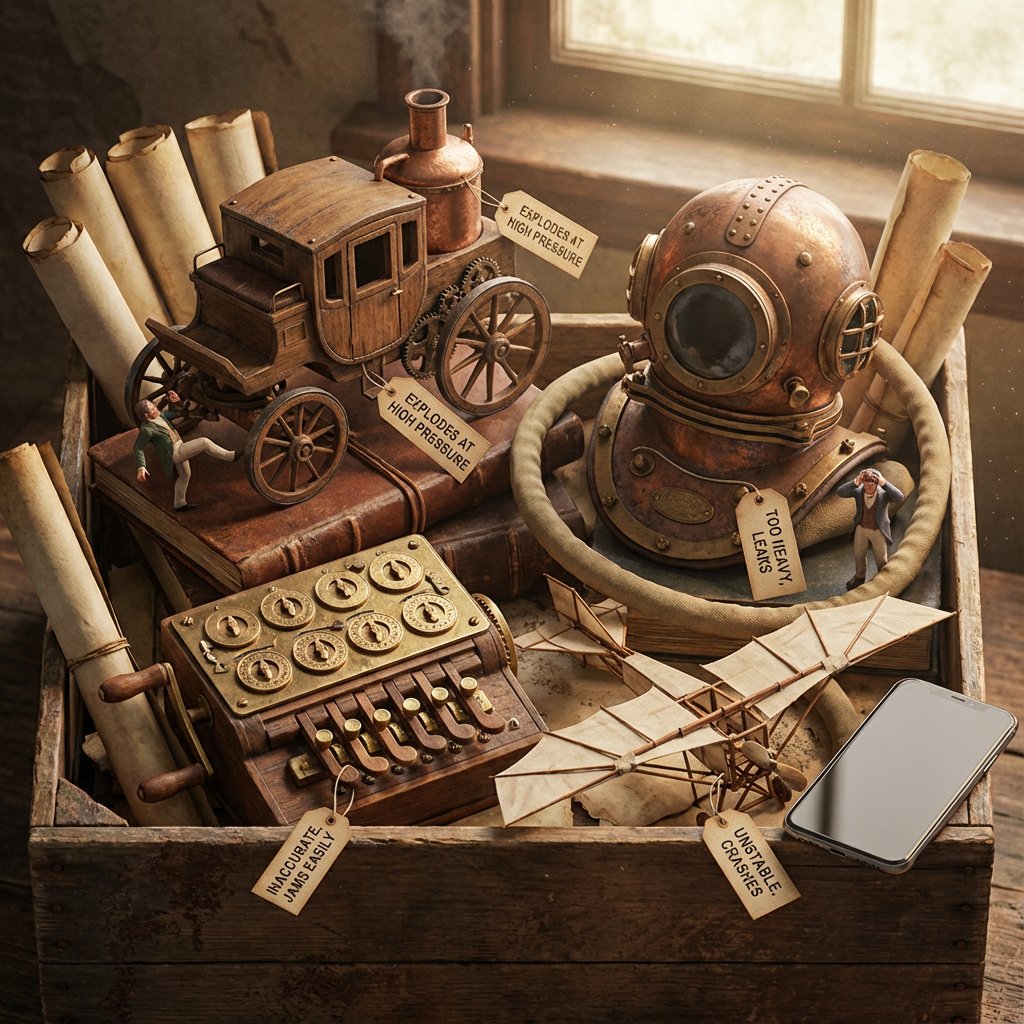
Historical Archivist Prompt for Flawed Inventions

Historical Archivist Prompt for Flawed Inventions

Role: Historical Archivist & Technical Illustrator. Input Era/Region: {argument name="era and region" default="US, 1820s"} Phase 1: The Deep Dive (AI to Deduce) 1. Identify Container: Era-appropriate storage (Chest, Cabinet, Box). 2. Identify Paperwork: Era-appropriate medium (Vellum, Blueprints, Floppy Disks). 3. Identify 4 Obscure Failures: Constraint: Do NOT select famous successes. Select Bizarre, Failed, or Dangerous prototypes. Data Extraction: For each item, identify its Historical Name and its Fatal Flaw. Phase 2: The Visual Translation Layer (Geometry) Logic: The AI must explicitly analyze the Physical Form Factor of each selected invention. Instruction: Do not render generic shapes. If it's a "Steam Man," render a brass robot. If it's a "Pneumatic Tube," render the piping. Phase 3: Visual Execution Subject: The [Container] overflowing with the [Signature Geometries] of the lost inventions. 1. The "Lost" Prototypes: Render the 4 inventions based strictly on their Physical Form Factor. Material: Authentic materials (Brass, Wood, Bakelite, Clay) based on the era. 2. The Labels (CRITICAL UPDATE): Format: Each item has a clearly attached tag (String/Wax/Adhesive) with Legible Text. Text Structure: Line 1:[The Invention Name] (e.g., "The Dynasphere"). Line 2:[The Flaw] (e.g., "Unstable Steering"). Note:Ensure the text looks handwritten or stamped according to the time period. 3. The Narrative: The Inventors: Tiny figurines reacting to the failure (frustrated, crying, kicking the machine). The Contrast: A generic Modern Smartphone (or futuristic device) sitting on the edge for scale/irony. 4. Atmosphere: Lighting: Dramatic, moody, specific to the era. Texture: Macro details of rust, dust, and age. Output: ONE image, 4:5, Photorealistic Macro Photography, Legible Text Labels.

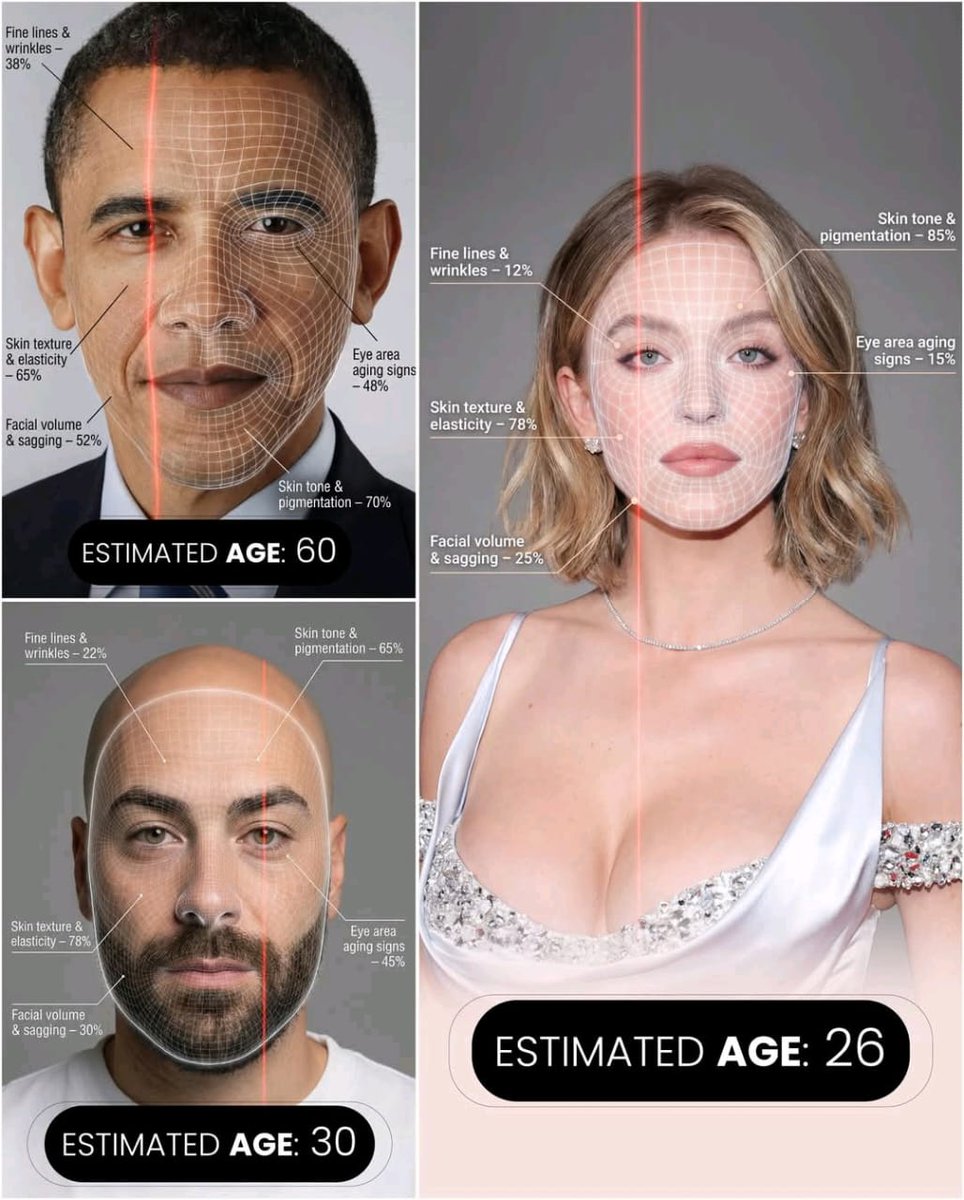
Futuristic AI Age Checker Infographic Portrait

Futuristic AI Age Checker Infographic Portrait

A hyper-realistic, high-resolution portrait infographic based on (your photo). Keep the same person, identity, hairstyle, clothing and natural skin tone from (your photo), with a neutral studio background.Overlay a subtle, semi-transparent facial analysis grid on the entire face, very similar to a 3D face-scanning mesh: thin, soft white lines following the facial contours, slightly glowing but not hiding the skin details. Add one clean vertical red laser line running down one side of the face, like a futuristic scan. All analysis lines must be soft, minimal and elegant, exactly like a cosmetic-tech advertisement.Create a clean medical–aesthetic infographic that evaluates 5 aging factors using global data percentages:1. Fine lines and wrinkles2. Skin texture and elasticity3. Facial volume and sagging4. Eye area aging signs5. Skin tone and pigmentationFor each factor, place a small label with a thin line pointing to the relevant facial area, and next to it write a short title and a realistic percentage score from 0–100% (based on global data), for example:“Fine lines & wrinkles – 18%”“Skin texture & elasticity – 72%”“Facial volume & sagging – 35%”“Eye area aging signs – 41%”“Skin tone & pigmentation – 63%”Use clean, modern, sans-serif typography and small technical-style text, like a scientific facial analysis UI. At the bottom of the image, in the center, write a large bold text showing the final estimated real age based on the analysis, for example:“ESTIMATED AGE: {argument name="estimated age" default="(random number based on face analysis )"}”Overall style: futuristic AI-guided skincare analysis, minimalistic, premium editorial lighting, no gender mentioned, suitable for any human face.

Annual Music Report Vinyl Record Infographic Prompt

Annual Music Report Vinyl Record Infographic Prompt

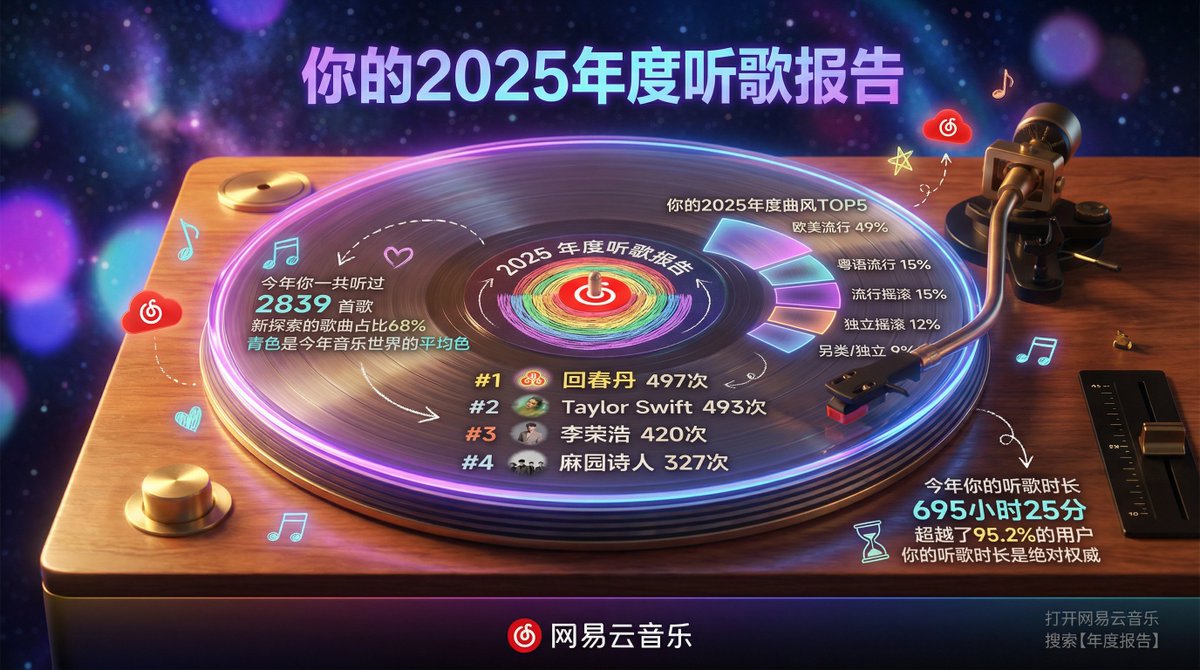
Hyper-realistic professional photography, a high-end transparent acrylic vinyl record placed on a classic turntable, slowly rotating and playing. The overall scene is set on a warm wooden turntable stand, with a dark, dreamy starry sky mixed with gradient neon lights in the background, creating a retro yet modern atmosphere. Subject - Transparent Acrylic Vinyl Record and Turntable: Record Material: Crystal clear transparent acrylic, with realistic reflections, glowing edges, and refraction effects. Classic vinyl groove textures are visible on the surface, but the whole is crystal clear. The record is rotating, with a slight motion blur. Turntable: Retro style wooden or metal platter base, the tonearm gently rests on the record, the stylus touches the grooves, details are realistic, including the spindle and speed adjustment knob. Content Style: Elegant modern typography combined with a slight hand-drawn feel. Text is directly “engraved” or projected onto the transparent record surface, with slightly imperfect lines. Record Center Label Area: Circular label printed with NetEase Cloud Music's red LOGO, surrounded by the words "{argument name="report year" default="2025"} Annual Listening Report." The label rotates with the record. Content Layout (Text and elements cleverly integrated into the record surface and grooves): Top Area (Upper outer edge of the record): Large title: "Your {argument name="report year" default="2025"} Annual Listening Report" using bold modern font, with purple-blue gradient and neon purple edge glow. Center Area - Favorite Artist Ranking (occupying about 40% of the center): Central illustration: Hand-drawn style reinforcement of the center label with the iconic pattern of #1 {argument name="artist 1" default="HuiChunDan"} (rainbow gradient circle), surrounded by small avatar icons of artists like Taylor Swift and Li Ronghao, slightly dynamic with rotation. Avatar icons are sourced from the reference image. Art Style: Simple line art with slight hand-drawn imperfections, full of personality. Colors: Main fill in deep purple and blue tones, white outline, neon purple and orange highlights. Artist ranking text arranged along the record grooves: #1 {argument name="artist 1" default="HuiChunDan"} 497 times, #2 Taylor Swift 493 times, #3 Li Ronghao 420 times, #4 Ma Yuan Shi Ren 327 times (Top 4), elegant glowing font, curved along the groove lines. Surrounding Information Display (Circular layout, text and icons distributed on the outer ring of the record and the turntable panel): Left Side (Left panel of the turntable) - Total Listening Volume and Style: Icons: Music note and heart. “You listened to 2839 songs this year” “New exploration songs accounted for 68%” “Cyan is the average color of the music world this year” Hand-drawn small arrow pointing to the center of the record. Top Right (Space above the record) - Annual Genre TOP 5: Icon: Flowing waveform. “Your {argument name="report year" default="2025"} Annual Genre TOP 5” European/American Pop 49%, Cantonese Pop 15%, Pop Rock 15%, Indie Rock 12%, Alternative/Indie 9% Displayed using percentage circles or sector diagrams surrounding the outer edge of the record, slightly glowing. Bottom (Turntable base panel) - Listening Duration: Icons: Hourglass and play button. “Your listening duration this year is 695 hours and 25 minutes” “Exceeding 95.2% of users” “Your listening duration is the absolute authority” Connecting Elements: Hand-drawn arrows and dashed lines connecting various parts of the turntable to the rotating record. Small Decorative Elements: Scattered music notes, stars, light spots, NetEase Cloud red small clouds, slightly floating with rotation. All text is in Chinese, elegant modern font with a slight handwritten feel. Color Scheme: Baseline: Cream white texture (#F5F5DC) Main Illustration: Deep purple-blue gradient fill, white outline Highlights: Neon purple (#A100FF) and orange used for emphasis and decoration Icons and Charts: Light grey (#B0B0B0) line art Brand Color: NetEase Cloud red (#E60026) used for LOGO and key emphasis Bottom Area (Front edge of the turntable): Dark gradient horizontal bar background Left: NetEase Cloud Music Red LOGO (metallic glow) Center: “NetEase Cloud Music” standard text Right: Small text “Open NetEase Cloud Music Search 【Annual Report】” Environment and Photography: Background: Dark dreamy starry sky with purple-blue neon gradient, extremely heavy blur. Depth of Field: f/1.4 large aperture simulation - background is almost completely abstract. Only soft purple, blue, and pink bokeh light spots are visible, with no discernible shapes. Perspective: Slightly overhead 45-degree frontal view, record and turntable perfectly centered, capturing rotational dynamics. Lighting: Warm side light and professional spotlight creating strong reflections on the acrylic surface, dramatic neon purple glowing edge, subtle highlights captured on the tonearm and stylus. Atmosphere: Nighttime retro dreamy atmosphere, transparent acrylic record glowing while spinning on the turntable, heavy background blur highlighting the main subject. Technical Specifications: 8K ultra-high resolution, cinematic color grading high contrast, realistic acrylic material physics (edge glow, reflection, refraction, slight rotational blur), exquisite modern text details, high-end music photography quality, extreme background bokeh making the record and turntable content the absolute focal point. Key requirement: Background must be extremely blurred (almost abstract bokeh), the central transparent vinyl record must have a realistic sense of rotation, elegant modern text integrated into the record surface, all elements incorporating the user-provided 2025 NetEase Cloud annual summary data, strong overall retro turntable atmosphere.

Medical Infographic Poster Prompt using Bento Grid Layout

Medical Infographic Poster Prompt using Bento Grid Layout

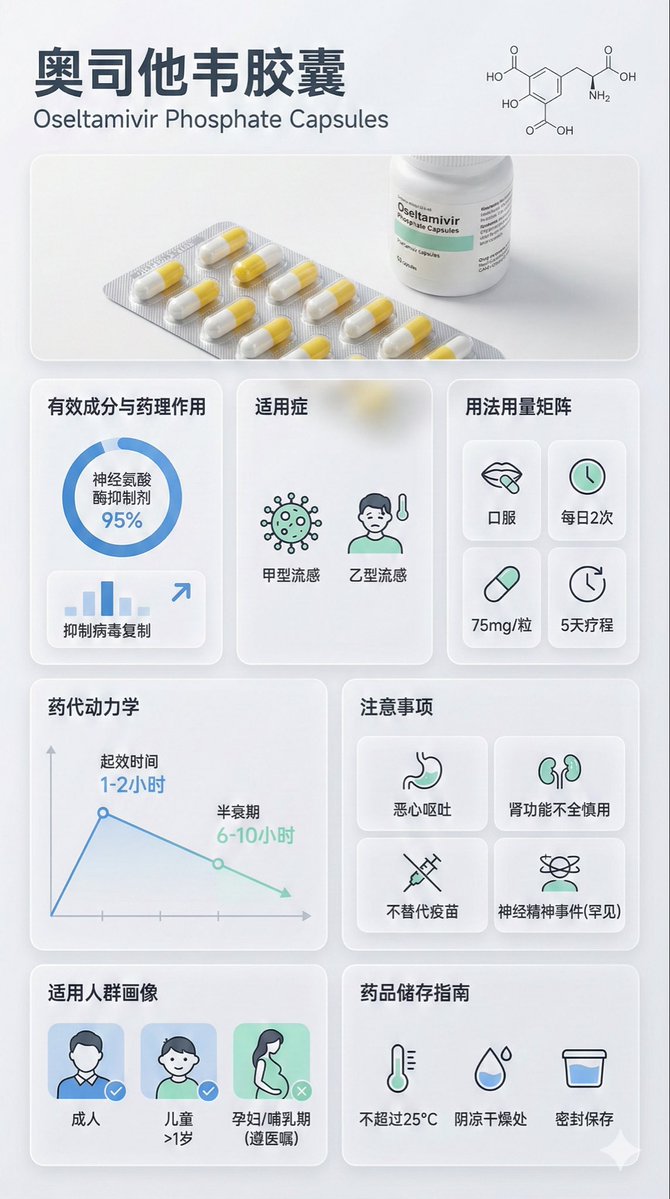
{ "image_analysis": { "subject": "{argument name="drug name" default="Oseltamivir Capsule"} Science Infographic, 9:16", "style": "Modular Bento Grid Design / Minimalist Medical UI Design", "tone": "Professional, Clinical, Rigorous, Scientific, Trustworthy", "primary_colors": ["Clinical White", "Medical Blue", "Slate Grey", "Mint Green"] }, "prompt_elements": { "subject_description": "A high-quality science infographic poster about {argument name="drug name" default="Oseltamivir Capsule"}.", "layout": "Bento box style modular grid layout, clean medical UI/UX interface design, divided into clear rectangular cards.", "visual_details": [ "Top header with striking modern sans-serif font title 'Chinese Drug Name' and its chemical/generic name", "Center top features an ultra-realistic macro photograph of the [Drug Form/Packaging] (e.g., tablet, capsule, or bottle)", "A minimalist line drawing of the [Chemical Structure] in the corner", "Section 1: Analysis of active ingredients and pharmacology with circular and bar charts, data visualization", "Section 2: Indications with minimalist line icons", "Section 3: Dosage and Administration matrix with minimalist line icons ([Oral/Injection], [Frequency], [Dose])", "Section 4: Pharmacokinetics or onset time axis with line charts", "Section 5: Precautions grid with simple warning icons ([Drug Interactions], [Contraindications], [Side Effects]), drug interactions, contraindications, side effects require online search", "Section 6: Applicable population profile icons (e.g., suitability markers for elderly, children, pregnant women)", "Section 7: Drug storage guidelines with thermometer and humidity icons" ], "art_style": "Minimalist scientific visualization design, combining detailed medical illustrations with product photography, flat medical icons, Swiss-style typography.", "lighting": "Bright laboratory shadowless lighting, clean and clear, emphasizing sterility and clarity.", "color_palette": "Monochromatic clinical white or light grey background, translucent frosted glass cards, dark grey and navy blue text, accented with medical blue or cyan to highlight key points." }, "negative_prompt": "Clutter, warm tones, vintage style, handwriting, low resolution, blur, distorted text, noise, dark background, unsanitary, oversaturated, watermark, food texture"

Bento Grid Infographic Prompt for Food Science

Bento Grid Infographic Prompt for Food Science

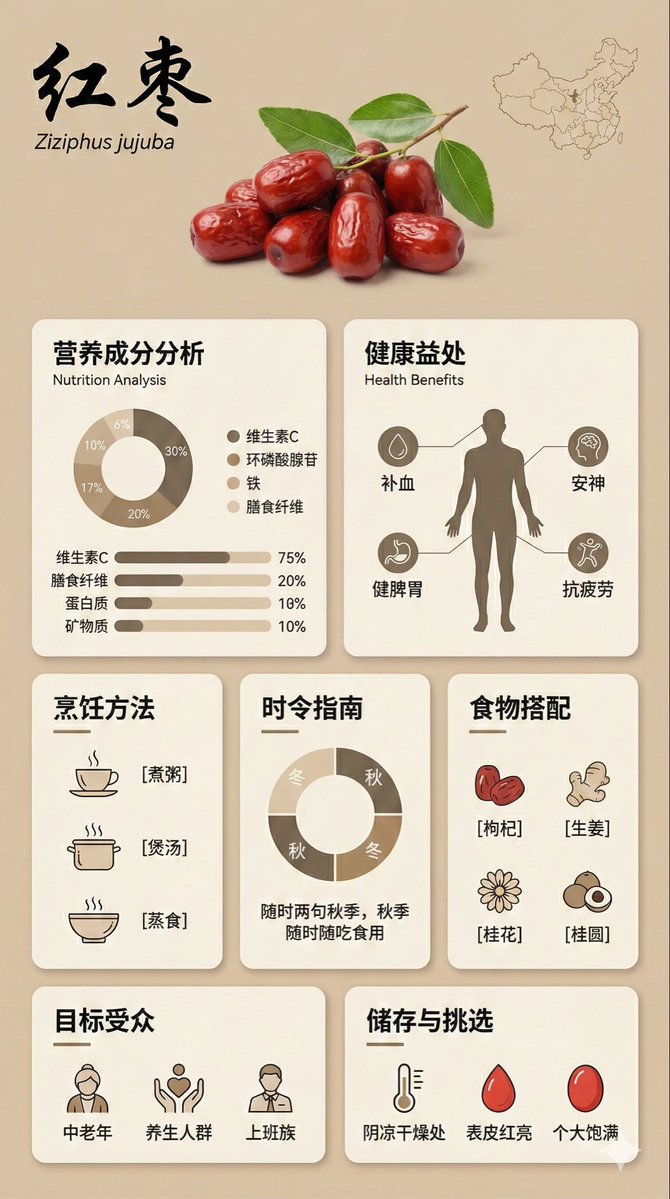
{ "image_analysis": { "subject": "Infographic about {argument name="ingredient name" default="Goji Berry"}, 9:16", "style": "Modular Bento Grid Design / Minimalist UI Design", "tone": "Professional, warm, high-end, educational", "primary_colors": ["Beige", "Cream", "Dark Brown", "Warm Earth Tones"] }, "prompt_elements": { "subject_description": "A high-quality educational infographic poster about {argument name="ingredient name" default="Goji Berry"}.", "layout": "Bento box style modular grid layout, clean UI/UX interface design, divided into clear rectangular cards.", "visual_details": [ "Top header with a striking, elegant Chinese calligraphy title 'Ingredient Chinese Name' and its scientific name", "Center top features a hyper-realistic photographic image of [visual description of fresh ingredient]", "A small outline map of [origin/country] in the corner", "Section 1: Nutritional analysis with donut charts and bar charts, percentages indicating proportions", "Section 2: Human silhouette diagram showing health benefits with connecting lines", "Section 3: Cooking method matrix with minimalist line icons ([Cooking Method 1], [Cooking Method 2], [Cooking Method 3])", "Section 4: Seasonal consumption guide with circular charts", "Section 5: Food pairing grid with simple icons ([Pairing 1], [Pairing 2], [Pairing 3])", "Section 6: Target audience profile icon", "Section 7: Storage and selection guide with temperature and weather icons" ], "art_style": "Minimalist graphic design, soft vector illustrations combined with product photography, flat design icons, clean typography.", "lighting": "Soft diffused studio lighting, shadowless and flat lay aesthetic.", "color_palette": "Monochromatic warm beige background, off-white cards, dark brown and charcoal grey text, soft accents." "negative_prompt": "Cluttered, neon colors, messy layout, low resolution, blurry, distorted text, 3D rendering, dark background, chaos, oversaturated, watermark" }

Miniature Bridge of Ancient Mathematical Knowledge

Miniature Bridge of Ancient Mathematical Knowledge

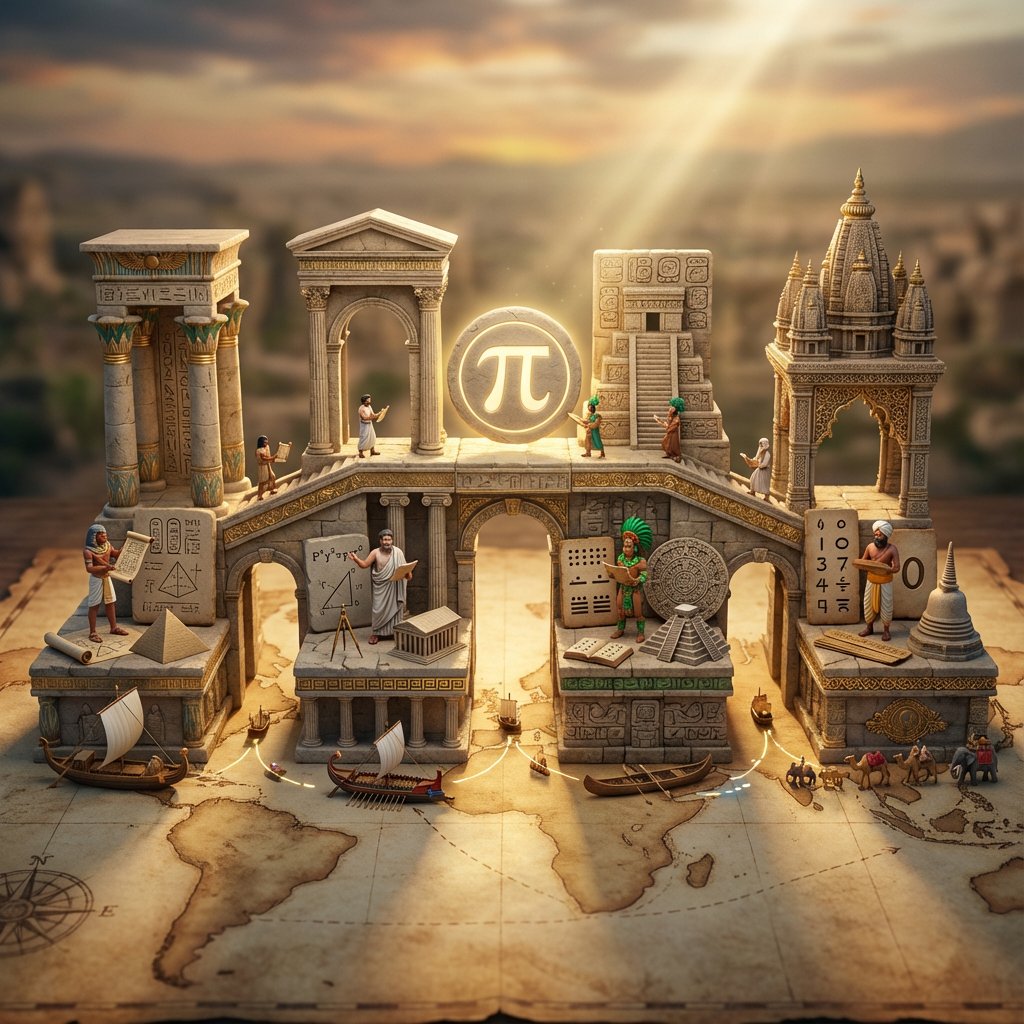
<instruction> Input A is an invention or technology Analyze: how this innovation appeared independently or was transmitted across ancient civilizations (Egyptian, Chinese, Islamic, Mayan, Greek, etc.). Goal: Miniature bridge structure connecting 3-5 civilization "islands." Rules: * Base: ancient world map (aged parchment) as foundation * Bridge structure: ornate multi-level walkway with different architectural styles for each section (columns, arches, pagoda elements) * Each "island" platform: distinct civilization's version of Input A invention (Chinese compass vs Viking sunstone, Mayan zero vs Indian zero, etc.) * Civilization figurines: tiny scholars/inventors from each culture examining each other's versions * Include: trade route markers, tiny ships/caravans between islands, scrolls being passed * Center of bridge: the "universal truth" they all discovered (mathematical formula, physical principle) etched in neutral symbol * Materials: stone textures, gold leaf accents, cultural pattern details * Lighting: mystical golden hour with light ray connecting all islands Output: 1 x image, 16:9 landscape for maximum bridge span visibility, mythological epic photography </instruction>

3D Isometric Atlas Scene in Firefly Style

3D Isometric Atlas Scene in Firefly Style

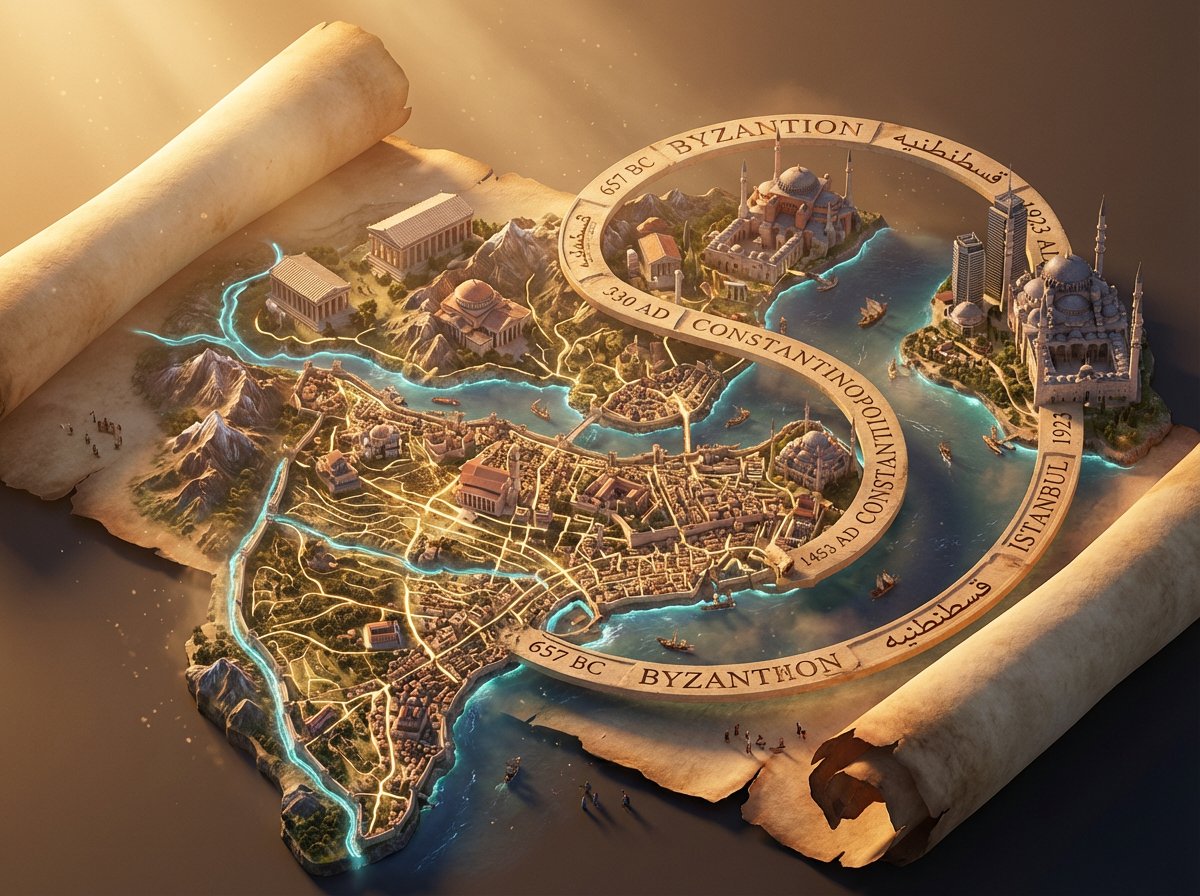
Epic 3D isometric atlas scene: a massive ancient map of {argument name="subject" default="[SUBJECT]"} erupts from an unfurled parchment scroll, filling nearly the entire frame. Ink lines ignite into living terrain: mountain ranges push upward, cities rise in vertical layers, rivers glow and flow, borders burn softly in gold. Multiple civilizations {argument name="civilization layers" default="[CIVILIZATION LAYERS]"} coexist in stacked time, their architectures phasing through one another as if time is folding. A carved timeline spirals across the map with engraved dates. All text in {argument name="language" default="[LANGUAGE]"}. Extreme scale contrast, dense micro-detail everywhere, dramatic golden-hour light, volumetric dust, cinematic depth, 8K, UE5.

Macro Diorama Historical Rivalry (Science Wars)

Macro Diorama Historical Rivalry (Science Wars)

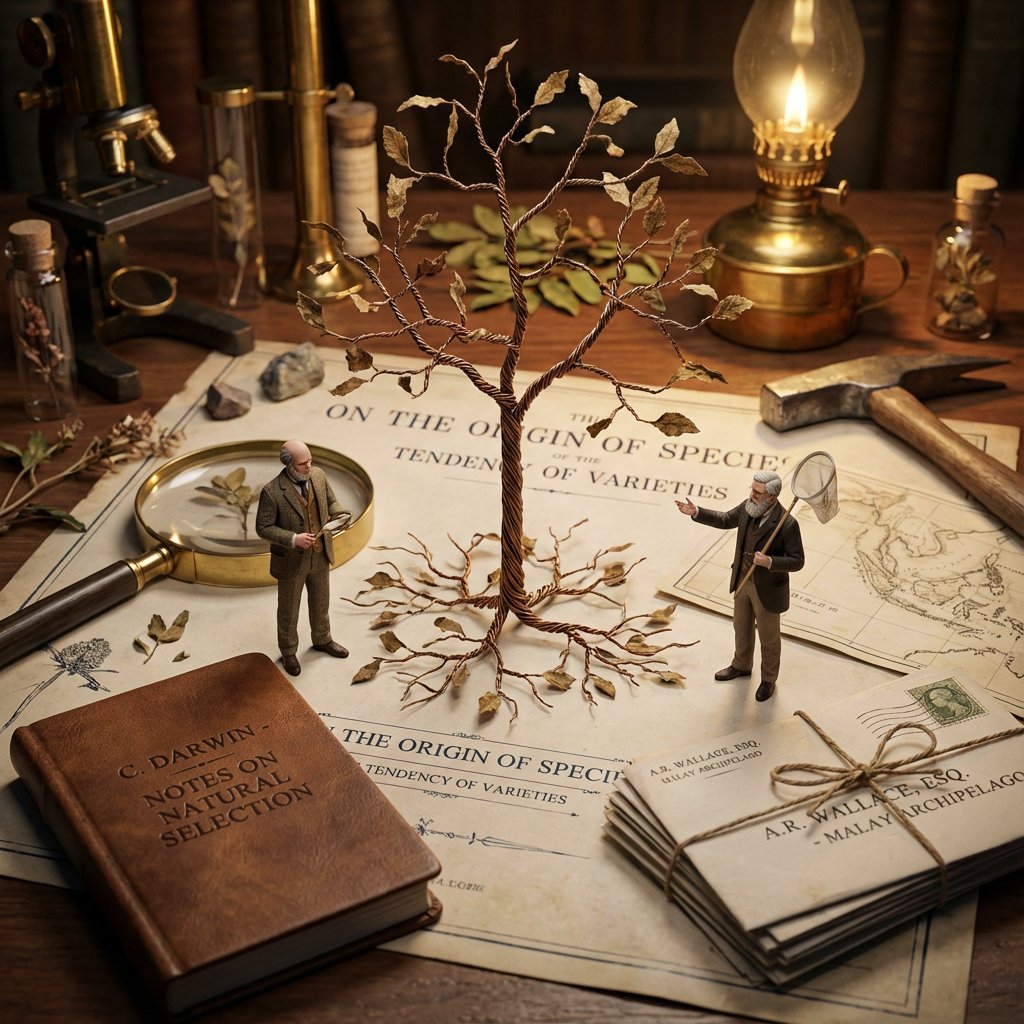
<instructions> Input: Invention/Rivalry = {argument name="invention/rivalry" default="[User Choice]"} Phase 1: Chronological Profiling Ancient (Pre-500 AD): Stone/Papyrus, Oil Lamps. Labeling = Carved symbols or scroll signatures. Renaissance (1400-1600): Parchment, Candlelight. Labeling = Wax seals, hand-lettered envelopes, book spines. Industrial (1800-1940): Blueprints, Gaslight. Labeling = Typed Patent headers, Business Cards, Newspaper Headlines. Modern (1950-Present): Circuit diagrams, Neon. Labeling = ID Badges, Magazine covers, Computer login screens. Phase 2: Goal: A hyper-detailed Macro Diorama where the environment identifies the rivals. 1. The Stage (The Document): The ground is the primary design medium of the era (Clay Tablet, Parchment, Blueprint, or CAD Printout). The Invention:A 3D Prototype is rising from the center, separating the two figures. 2. The Living Miniatures: Two tiny, hyper-realistic figurines (The Rivals) interact with the invention. They are dressed strictly in period-accurate clothing. 3. The Identity Anchors (CRITICAL - Labeling): Instruction: You must seamlessly integrate readable text into the "Giant" props near each figure to identify them to the viewer. Prop A (Near Rival 1): Place a "Giant" personal item with their name visible. (e.g., A letter addressed to "Mr. T. Edison", a book titled "By C. Darwin", or a security badge reading "S. Jobs"). Prop B (Near Rival 2):Do the same for the second figure. (e.g., A Patent application signed "Nikola Tesla", or a court summons for "Mark Zuckerberg"). Context: These items must look like they were carelessly left on the desk, not floating labels. 4. The "Giant" Atmosphere: The Tools: Giant-scale era-appropriate tools (Chisels, Quills, Soldering Irons) tower over the figures. The Clutter: Period-specific debris (Marble dust, Ink spills, Burnt fuses, Empty soda cans). 5. Technical Specs: Lighting: Era-appropriate source (Fire vs. Filament vs. LED). Perspective:Tilt-shift macro photography (45-degree angle). focus on the miniatures. Output: ONE image, 4:5 aspect ratio, photorealistic historical macro photography with legible environmental text. </instructions>

Detective Evidence Board Generation

Detective Evidence Board Generation

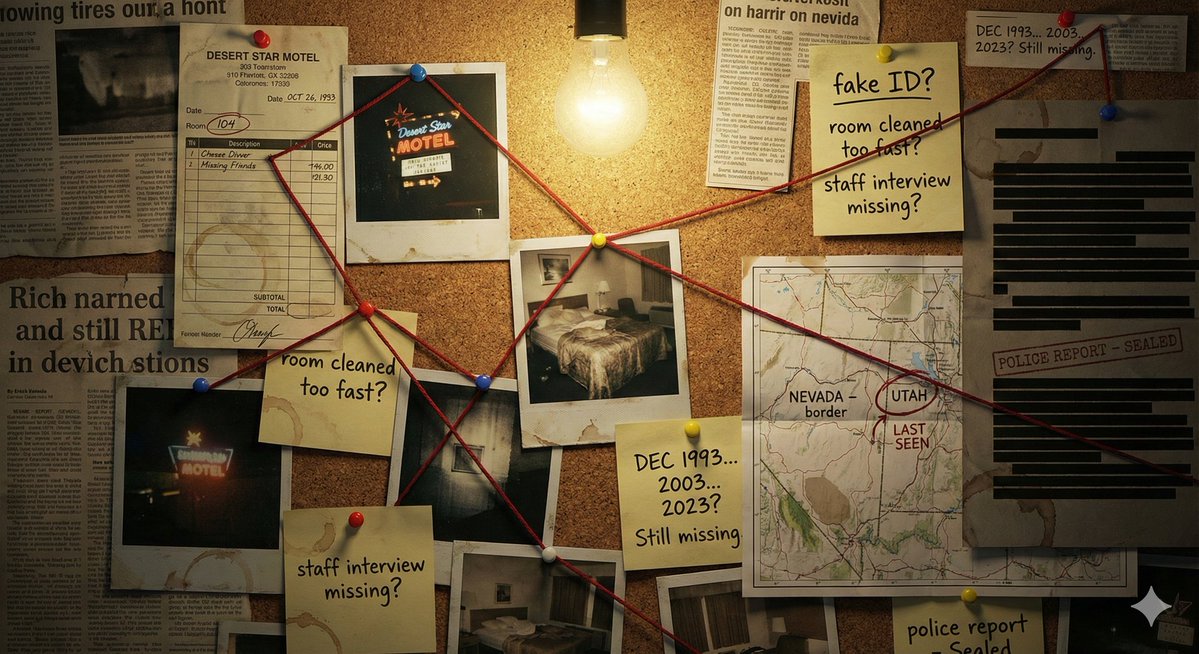
"A detective's evidence board investigating \\{argument name="subject/mystery" default="[SUBJECT/MYSTERY]"}\\\. Cork surface covered with pinned items: polaroid photographs with handwritten dates, a street map with circled locations, newspaper clippings with highlighted passages, sticky notes with theories and question marks, and printed documents with redacted black bars. Red string connects related evidence across the board, creating a web of connections. Thumbtacks in primary colors. A single bare bulb casts dramatic shadows. Coffee ring stains on some papers. The atmosphere is obsessive, late-night, noir—someone has been piecing this together for months. A few pins have fallen, suggesting frantic recent activity."

LEGO History Retelling Template

LEGO History Retelling Template

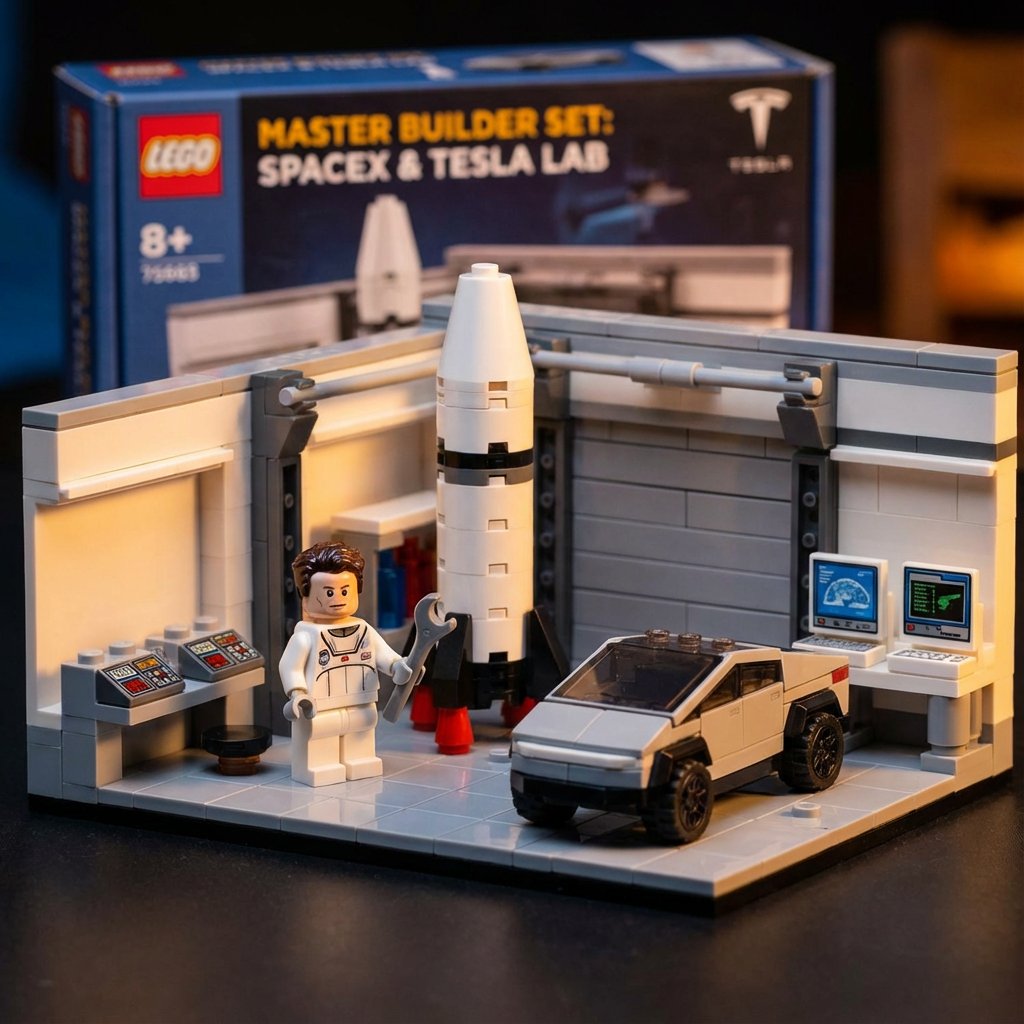
<instructions> Retelling history through plastic construction blocks. Input Variable: {argument name="inventor" default="[INSERT INVENTOR]"} Workflow: 1. Medium Shift: The subject and their laboratory are constructed entirely of high-gloss plastic interlocking bricks (LEGO-style). 2. Context: A "Master Builder" set depicting a famous laboratory relevant to the inventor. 3. Action: The minifigure version of [INSERT INVENTOR] is holding a tiny plastic tool, standing next to a brick-built version of his greatest invention, building, or lab environment. Style: Macro Toy Photography (Tilt-Shift). </instructions>

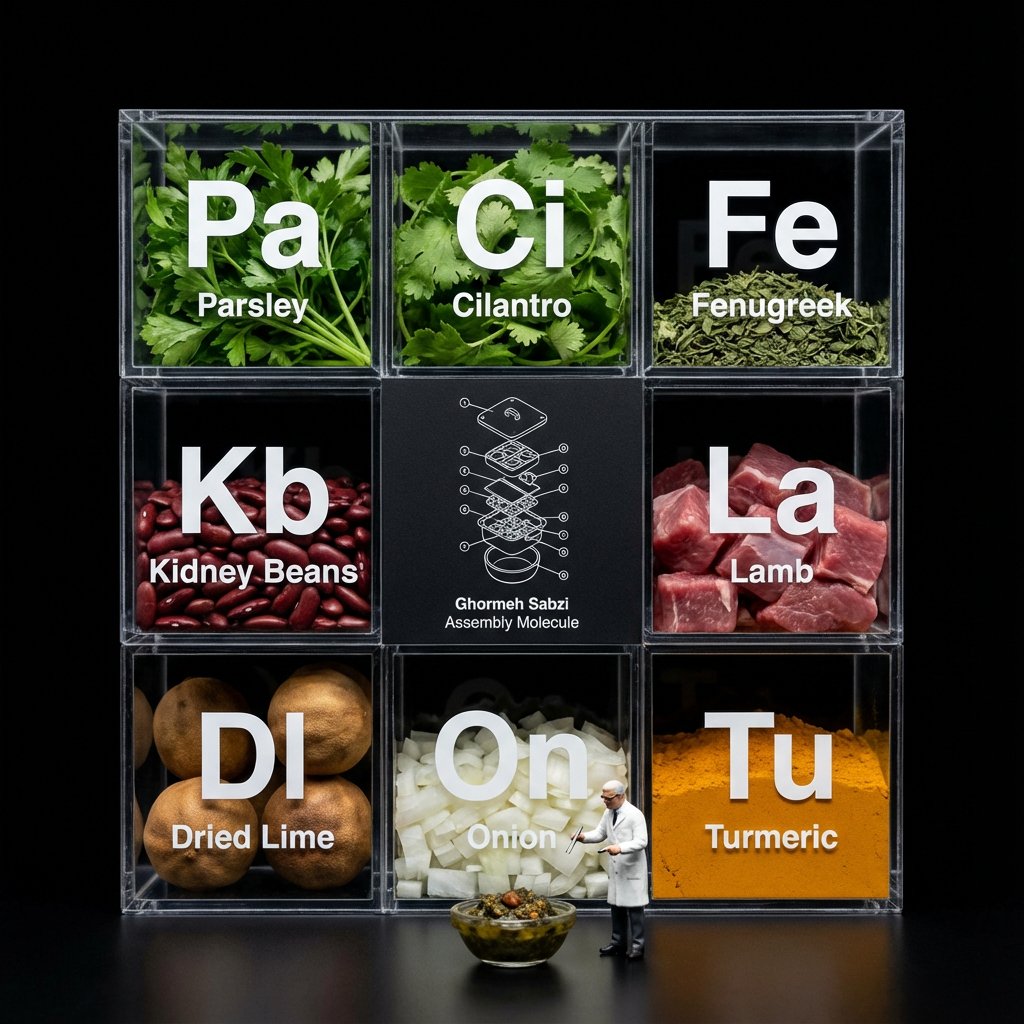
Molecular Gastronomy Display Box for Food Visualization

Molecular Gastronomy Display Box for Food Visualization

Do this for [your meal] Do this for {argument name="food item" default="pineapple pizza"} <instruction> Input A is a complex food item. Analyze: Break the item down into raw ingredients and assign each a "Periodic Table" style abbreviation (e.g., To, Li, On). Goal: A "Molecular Gastronomy" acrylic display box set against a void black background. Rules: Layout: determine layout based on # of ingredients, always round up to square or rectangle, clear acrylic grid box. Center Slot: The center square is NOT clear; it is a matte black card featuring a white technical exploded view blueprint/wireframe of Input A labeled "[{argument name="food name" default="food name"}] Assembly Molecule." Surrounding Slots: The outer slots contain the fresh, raw ingredients (tortillas, lime wedges, chopped onions, meat). Typography: Large white "Periodic Table" style lettering (Symbol + Name) printed on the front glass of each compartment, floating over the ingredients. Figure: A 1:12 scale miniature scientist in a lab coat standing on the table surface in front of the box, interacting with a miniature version of Input A. Lighting & Atmosphere: Dark Mode aesthetic. Stark contrast lighting, pure black background, sharp reflections on the acrylic edges. Output: ONE image, 1:1, macro photography, 8k resolution. </instruction>

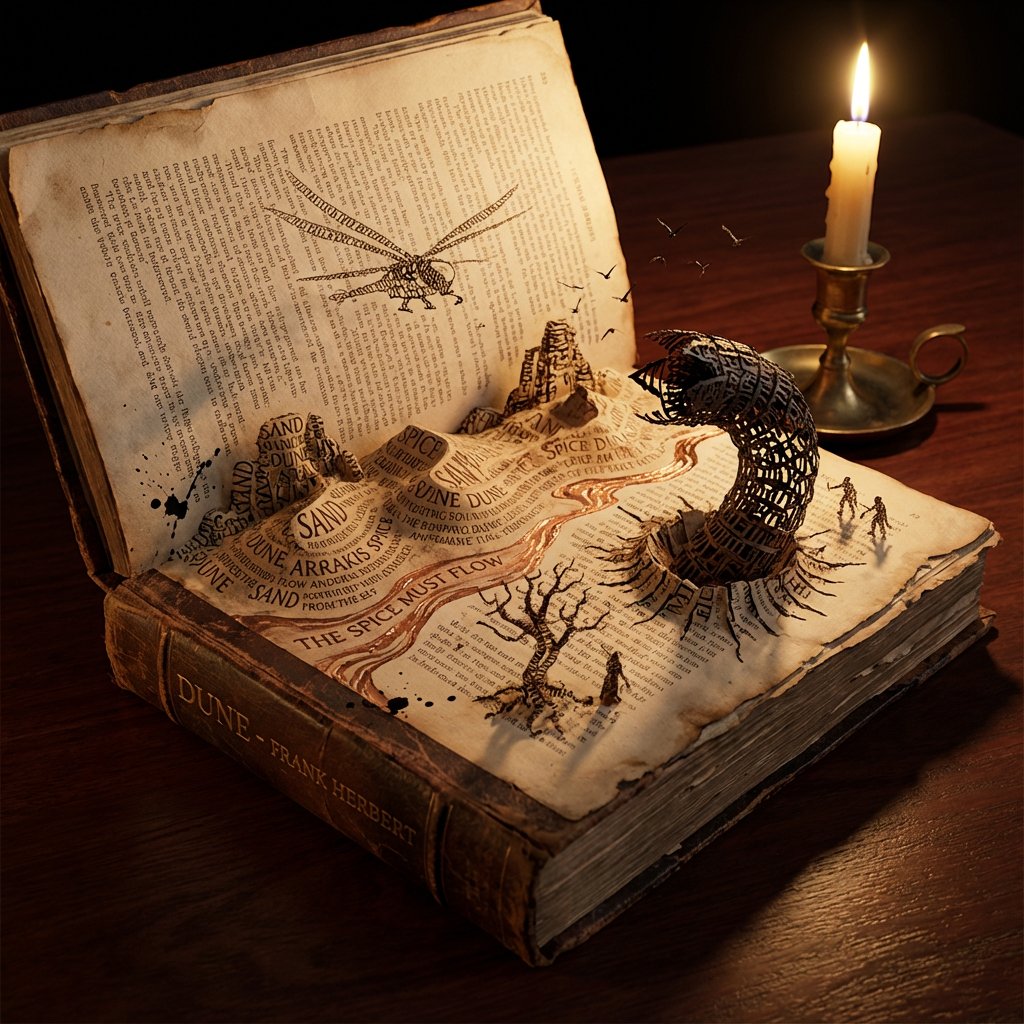
Storybook Typography Diorama Prompt (Dune)

Storybook Typography Diorama Prompt (Dune)

Do this for {argument name="book title" default="Dune"} <instructions> Concept: A storybook where the text creates the environment. Input: [Input: Moby Dick / Alice in Wonderland / {argument name="book title 2" default="Dune"}] Analysis: Extract key settings, protagonists, sensory details, and dominant color palette. Goal: An open book where the typography collapses into the physical world. Rules: Base: An antique leather-bound book lying open on a dark mahogany desk. Transformation: The ink text creates the terrain—words pile up to form mountains, sentences flow like rivers, letters twist into trees or creatures. Scale: Isometric miniature world emerging from the page. Details: Paper texture, embossed letters, ink splatter turning into birds or debris. Lighting: Candlelight flickering, casting dynamic shadows that seem alive. Output: Hyper-realistic fantasy realism, Octane render style. </instructions>

Some prompts are collected from creators on X. Copyright belongs to the original authors.